TED日本語
TED Talks(英語 日本語字幕付き動画)
TED日本語 - ショーン・ゴーリー: 戦争の数理学
TED Talks
戦争の数理学
Sean Gourley on the mathematics of war
ショーン・ゴーリー
内容
あらゆるニュースから集めたデータをもとに、ショーン・ゴーリーのチームが照らし出すのは、現代の戦争が持つ驚愕の構造である。 もしかするとそれは、戦争を解きほぐす鍵かもしれない。


字幕
SCRIPT
Script
We look around the media, as we see on the news from Iraq, Afghanistan, Sierra Leone, and the conflict seems incomprehensible to us. And that's certainly how it seemed to me when I started this project. But as a physicist, I thought, well if you give me some data, I could maybe understand this. You know, give us a go.
So as a naive New Zealander I thought, well I'll go to the Pentagon. Can you get me some information? (Laughter) No. So I had to think a little harder. And I was watching the news one night in Oxford. And I looked down at the chattering heads on my channel of choice. And I saw that there was information there. There was data within the streams of news that we consume. All this noise around us actually has information. So what I started thinking was, perhaps there is something like open source intelligence here. If we can get enough of these streams of information together, we can perhaps start to understand the war.
So this is exactly what I did. We started bringing a team together, an interdisciplinary team of scientists, of economists, mathematicians. We brought these guys together and we started to try and solve this. We did it in three steps. The first step we did was to collect. We did 130 different sources of information -- from NGO reports to newspapers and cable news. We brought this raw data in and we filtered it. We extracted the key bits on information to build the database. That database contained the timing of attacks, the location, the size and the weapons used. It's all in the streams of information we consume daily, we just have to know how to pull it out. And once we had this we could start doing some cool stuff. What if we were to look at the distribution of the sizes of attacks? What would that tell us?
So we started doing this. And you can see here on the horizontal axis you've got the number of people killed in an attack or the size of the attack. And on the vertical axis you've got the number of attacks. So we plot data for sample on this. You see some sort of random distribution -- perhaps 67 attacks,one person was killed, or 47 attacks where seven people were killed. We did this exact same thing for Iraq. And we didn't know, for Iraq what we were going to find. It turns out what we found was pretty surprising. You take all of the conflict, all of the chaos, all of the noise, and out of that comes this precise mathematical distribution of the way attacks are ordered in this conflict. This blew our mind. Why should a conflict like Iraq have this as its fundamental signature? Why should there be order in war? We didn't really understand that. We thought maybe there is something special about Iraq. So we looked at a few more conflicts. We looked at Colombia, we looked at Afghanistan, and we looked at Senegal.
And the same pattern emerged in each conflict. This wasn't supposed to happen. These are different wars, with different religious factions, different political factions, and different socioeconomic problems. And yet the fundamental patterns underlying them are the same. So we went a little wider. We looked around the world at all the data we could get our hands on. From Peru to Indonesia, we studied this same pattern again. And we found that not only were the distributions these straight lines, but the slope of these lines, they clustered around this value of alpha equals 2.5. And we could generate an equation that could predict the likelihood of an attack. What we're saying here is the probability of an attack killing X number of people in a country like Iraq is equal to a constant, times the size of that attack, raised to the power of negative alpha. And negative alpha is the slope of that line I showed you before.
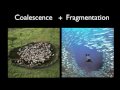
So what? This is data, statistics. What does it tell us about these conflicts? That was a challenge we had to face as physicists. How do we explain this? And what we really found was that alpha, if we think about it, is the organizational structure of the insurgency. Alpha is the distribution of the sizes of attacks, which is really the distribution of the group strength carrying out the attacks. So we look at a process of group dynamics: coalescence and fragmentation, groups coming together, groups breaking apart. And we start running the numbers on this. Can we simulate it? Can we create the kind of patterns that we're seeing in places like Iraq? Turns out we kind of do a reasonable job. We can run these simulations. We can recreate this using a process of group dynamics to explain the patterns that we see all around the conflicts around the world.
So what's going on? Why should these different -- seemingly different conflicts have the same patterns? Now what I believe is going on is that the insurgent forces, they evolve over time. They adapt. And it turns out there is only one solution to fight a much stronger enemy. And if you don't find that solution as an insurgent force, you don't exist. So every insurgent force that is ongoing, every conflict that is ongoing, it's going to look something like this. And that is what we think is happening.
Taking it forward, how do we change it? How do we end a war like Iraq? What does it look like? Alpha is the structure. It's got a stable state at 2.5. This is what wars look like when they continue. We've got to change that. We can push it up: the forces become more fragmented; there is more of them, but they are weaker. Or we push it down: they're more robust; there is less groups; but perhaps you can sit and talk to them.
So this graph here, I'm going to show you now. No one has seen this before. This is literally stuff that we've come through last week. And we see the evolution of Alpha through time. We see it start. And we see it grow up to the stable state the wars around the world look like. And it stays there through the invasion of Fallujah until the Samarra bombings in the Iraqi elections of '06. And the system gets perturbed. It moves upwards to a fragmented state. This is when the surge happens. And depending on who you ask, the surge was supposed to push it up even further. The opposite happened. The groups became stronger. They became more robust. And so I'm thinking, right, great, it's going to keep going down. We can talk to them. We can get a solution. The opposite happened. It's moved up again. The groups are more fragmented. And this tells me one of two things. Either we're back where we started and the surge has had no effect; or finally the groups have been fragmented to the extent that we can start to think about maybe moving out. I don't know what the answer is to that. But I know that we should be looking at the structure of the insurgency to answer that question. Thank you. (Applause)
私たちは皆、メディアに注意を払っています イラクや アフガン、シエラレオネからのニュースを見聞きしていると 紛争というものが非常に不可解にうつります この感覚こそ、私がこのプロジェクトを始めた契機でした ただ、物理学者としての私は データさえ手に入れば解読できるかもしれない やってみようじゃないか と思ったのです
世間知らずのニュージーランド人だった私は まぁ、まずペンタゴンに行ってみよう と思い そこで、情報をくれませんかと尋ねるわけです もちろん答えはノーですが (笑) それで、頭を使わなきゃいけなくなったわけです 当時はオックスフォードで、ある晩ニュースを見ていて チャンネルの下に出てくるテロップを眺めていると 立派な情報といえるものがそこにありました 横に流れてゆくニュース字幕にデータが隠れていたのです 身の回りのこんなノイズにも実は情報が隠れているのです そこで私は ここにはオープンソースの知とでも呼べるものがあると捉え始めました ここから十分なデータが集まれば 戦争を理解する最初の鍵が得られるかもしれない
調査はこのようにおこないました まずチーム編成をするにあたり 経済学や数学などの分野から 学問領域を越え、科学者を呼びました 彼らを迎え、晴れて調査は始まりました 3つのステップで行いました 第一に情報収集 NGOのレポートや新聞、ケーブルテレビにいたる 130を越えるあらゆるソースからの情報にあたりました これらの基礎データを寄せ集めフィルターをかけます そして、情報の中から変数となりうる鍵を抽出します データベースには 攻撃の時期や 場所、規模、使用された兵器を組み込みました こんなものが実は日々垂れ流される情報に潜んでいるのです 要は、どう解読するかがものをいうのです ここからはお手の物です 攻撃の規模の分布を見ていくとどうでしょう ここから何が言えるでしょうか
まず、そこから始めました ご覧のように 横軸には 攻撃で亡くなった方々の数 つまりは攻撃の規模です そして縦軸には、攻撃の回数を置きました するとここに各事例を配置していけるわけです ここにはある種のランダム分布が見えるかと思います 67回の攻撃で、一人が亡くなる場合もあれば 47回で7人という事例もあります 全く同じことをイラクの例に絞ってやってみました 結果がどうなるかは予見しようがなかったのですが 驚くべき結果が出ます すべての武力衝突から そしてその混沌、情報のノイズ そういったものの中から この紛争で、命令がなされた手法の 数学的に一貫した分布が導きだせるのです 驚愕でした なぜ、イラクのような例がこのような結果を 基本の特徴として持つのでしょうか 戦争に法則などあるものなんでしょうか まだまだ分からないことだらけでした きっとイラクは特殊な事例なのだと考え 他の事例にもあたってみることにしました コロンビアや、アフガニスタン セネガルに関しても検証してみました
グラフは、ここでも、まったくの同じパターンを描くのでした まさか、こんなことがあり得るのか 全く別々の戦争なわけだし、宗派や 政党、社会経済的な問題まで全く違うはずです にもかかわらず、そこには一貫した基礎パターンが 存在するのです そこで、さらに手を広げてみました 世界に範囲を拡大し、出来る限りのデータを集めました 南米はペルーからアジアはインドネシアまで またもや同じパターンが描き出されました わかったのは こういった直線の分布だけでなく その傾斜(係数)が、α=2.5という 値を中心として集まっているというものです ここから、攻撃の可能性を予測することの出来る 公式を導き出すことが出来ました ここで示されるのは X人の命を奪うという攻撃が、イラクのような国で 起こる可能性が 定数Cに攻撃の規模xを掛け、 -α乗したものに等しいということです -αというのは先ほどお見せした傾き(係数)のことです
だからどうだというのでしょう たかがデータ、統計です それが戦争の何を教えてくれるというのでしょう それは私たち物理学者にとっての挑戦でした どう説明すればいいのだろうか αというものを見つけた 突き詰めて言えばそれは、反乱組織の 集団の構造である αは攻撃の規模の分布であり それと同時に、攻撃をおこなう為の 集団の力の分布でもある そこで集団力学の変化に注目してみました 合併と分裂 時に集まり、時に散らばる そこに数字を当てはめてみたわけです シミュレートできるかどうか そこで、イラクの事例に見るようなパターンを 導き出せるかどうかを ここでも適切に処理することで シミュレーションを行うことができます 集団力学を応用し、世界中の戦争が持つ基礎パターンを 説明できるだけのグラフを 再構成しました
さて、どういうことでしょうか なぜ、少なくとも見かけ上は全く異なる戦争たちが 同じパターンを描くのか 私が見つけたのは 武装勢力は、時と共に進化、順応してゆくという現象です 一回りも二回りも強大な敵と戦うために 解決策は一つしかありません 武装勢力の一員としてその解決策を見つけない限りは その人物は存在しないも同然です だからこそ、全ての武装勢力の活動 全ての戦争・紛争において このような現象が立ち現れます そんなことが起こっているんだと思います
もう一歩進んでみましょう どうしたらこれを変えられるか イラクのような戦争はどうしたら終わらせることが出来るか そのときグラフはどう見えるだろうか αこそが構造でした この数値が2.5を保つ その数値が戦争が続く時を示します それを変えればいい 数値を上げれば 勢力は分裂し始める 数は増えるが、弱体化する もしくは数値を下げれば 強固にはなるが、規模が縮小する 腰を据えた対話ができるレベルかもしれない
そこで、これからお見せするグラフは 誰の目にもまだ触れていない、文字通り 出来立てほやほやのものです ここに数値αの変遷をみることが出来ます 最初の段階で、数値が安定状態へと近づいてゆきます 世界中の戦争が共通してもつ数値へと ファルージャ侵攻においても、数値α周辺をさまよい続けます その数値は2006年イラク選挙中の サマラ爆撃にいたるまで続きます そこで数値が乱れ始め、より高い値になってゆき 分裂状態へと向かいます それはまさに、戦況が激化したときでした 意見は分かれるところですが 当時、さらに激化が進むだろうと予期されていました しかし全く逆の結果となります 集団はより強大となり 堅調なものとなります ここで、よし、このまま数値が下がってくれればと思うわけです 対話し解決へと向かうことができると しかしまた、逆の結果が起きます 数値は上昇し、集団はより分散し始めます この二側面に 争いを終わらせる一つの鍵を見出すことが出来ます 紛争が始まったばかりの頃のように 武装勢力がなんの影響力も持たない状況に戻るか もしくは、分断化され 立ち退くことができるレベルに落ち着くか 戦争を終わらせるための明確な答えは分かりません ただ、その答えを出すためには どうやら戦争の構造に着目する必要がありそうです ご清聴ありがとうございました (拍手)
品詞分類
- 主語
- 動詞
- 助動詞
- 準動詞
- 関係詞等
TED 日本語
TED Talks
関連動画

人類の未来を変革する10年 あるいは地球が不安定化する10年ヨハン・ロックストローム
2020.10.15ビッグデータと小規模農場と2つのトマトの物語エリン・バウムガートナー
2020.09.11屋内垂直農場が農業の未来なのか?スチュアート・オダ
2020.02.07新しい政治の物語はすべてを変えられるジョージ・モンビオ
2019.09.05一過性の都市に見る驚異の建築術ラフール・メロトラ
2019.08.29政治家をあるものに置き換える大胆な構想セザー・ヒダルゴ
2019.04.03気候のための行動への心開かれる訴え | TED Talkグレタ・サンバーグ
おすすめ 12019.02.13気候変動に対してあなたが出来るいちばん大事なことキャサリン・ヘイホー
2019.01.11何をやるときにも自分に問う3つの質問ステイシー・エイブラムス
2019.01.08子供たちに学ぶ都市計画マーラ・ミンツァー
2018.11.28テクノロジー企業があなたを欺いてデータとプライバシーを放棄させる手口フィン・リュツォー=ホルム・ミスタッド
2018.11.21街の東側に貧困地域が多いのはなぜかスティーブン・デベリー
2018.09.12無人操縦エアタクシーが移動方法をどう変えるかロディン・リアソフ
2018.07.20悪夢のような子供向けYouTube動画 ― 今のインターネットのどこが間違っているのかジェームズ・ブライドル
2018.07.13もしも無作為に選ばれた人たちが政治家になったら - TED Talkブレット・ヘニッヒ
2018.06.26オンラインの嫌がらせコメントから、オフラインの建設的な対話を生む方法ディラン・マロン
2018.05.18
洋楽 おすすめ
RECOMMENDS
洋楽歌詞
ダイナマイトビーティーエス
洋楽最新ヒット2020.08.20ディス・イズ・ミーグレイテスト・ショーマン・キャスト
洋楽人気動画2018.01.11グッド・ライフGイージー、ケラーニ
洋楽人気動画2017.01.27ホワット・ドゥ・ユー・ミーン?ジャスティン・ビーバー
洋楽人気動画2015.08.28ファイト・ソングレイチェル・プラッテン
洋楽人気動画2015.05.19ラヴ・ミー・ライク・ユー・ドゥエリー・ゴールディング
洋楽人気動画2015.01.22アップタウン・ファンクブルーノ・マーズ、マーク・ロンソン
洋楽人気動画2014.11.20ブレイク・フリーアリアナ・グランデ
洋楽人気動画2014.08.12ハッピーファレル・ウィリアムス
ポップス2014.01.08カウンティング・スターズワンリパブリック
ロック2013.05.31ア・サウザンド・イヤーズクリスティーナ・ペリー
洋楽人気動画2011.10.26ユー・レイズ・ミー・アップケルティック・ウーマン
洋楽人気動画2008.05.30ルーズ・ユアセルフエミネム
洋楽人気動画2008.02.21ドント・ノー・ホワイノラ・ジョーンズ
洋楽人気動画2008.02.15オンリー・タイムエンヤ
洋楽人気動画2007.10.03ミス・ア・シングエアロスミス
ロック2007.08.18タイム・トゥ・セイ・グッバイサラ・ブライトマン
洋楽人気動画2007.06.08シェイプ・オブ・マイ・ハートスティング
洋楽人気動画2007.03.18ウィ・アー・ザ・ワールド(U.S.A. フォー・アフリカ)マイケル・ジャクソン
洋楽人気動画2006.05.14ホテル・カリフォルニアイーグルス
ロック2005.07.06