TED日本語
TED Talks(英語 日本語字幕付き動画)
TED日本語 - ジェームズ・バログ: コマ落とし撮影カメラが捉えた極地氷の喪失の証拠
TED Talks
コマ落とし撮影カメラが捉えた極地氷の喪失の証拠
Time-lapse proof of extreme ice loss
ジェームズ・バログ
James Balog
内容
写真家ジェームズ・バログが Extreme Ice Survey の連続映像を紹介します。それはネットワーク化されたコマ落とし撮影カメラの記録映像で、危機的な速度で退縮している氷河を記録しています。これまでで最も鮮明に気候変動を捉えた証拠写真の一部です。


字幕
SCRIPT
Script
Most of the time, art and science stare at each other across a gulf of mutual incomprehension. There is great confusion when the two look at each other. Art, of course, looks at the world through the psyche, the emotions -- the unconscious at times -- and of course the aesthetic. Science tends to look at the world through the rational, the quantitative -- things that can be measured and described -- but it gives art a terrific context of understanding.
In the Extreme Ice Survey, we're dedicated to bringing those two parts of human understanding together, to merging the art and science to the end of helping us understand nature and humanity's relationship with nature better. Specifically, I as a person who's been a professional nature photographer my whole adult life, am firmly of the belief that photography, video, film have tremendous powers for helping us understand and shape the way we think about nature and about ourselves in relationship to nature.
In this project, we're specifically interested, of course, in ice. I'm fascinated by the beauty of it, the mutability of it, the malleability of it, and the fabulous shapes in which it can carve itself. These first images are from Greenland. But ice has another meaning. Ice is the canary in the global coal mine. It's the place where we can see and touch and hear and feel climate change in action.
Climate change is a really abstract thing in most of the world. Whether or not you believe in it is based on your sense of is it raining more or is it raining less? Is it getting hotter or is it getting colder? What do the computer models say about this, that and the other thing? All of that, strip it away. In the world of the arctic and alpine environments, where the ice is, it's real and it's present. The changes are happening. They're very visible. They're photographable. They're measurable.
95 percent of the glaciers in the world are retreating or shrinking. That's outside Antarctica. 95 percent of the glaciers in the world are retreating or shrinking, and that's because the precipitation patterns and the temperature patterns are changing. There is no significant scientific dispute about that. It's been observed, it's measured, it's bomb-proof information. And the great irony and tragedy of our time is that a lot of the general public thinks that science is still arguing about that. Science is not arguing about that. In these images we see ice from enormous glaciers, ice sheets that are hundreds of thousands of years old breaking up into chunks, and chunk by chunk by chunk, iceberg by iceberg, turning into global sea level rise.
So, having seen all of this in the course of a 30-year career, I was still a skeptic about climate change until about 10 years ago, because I thought the story of climate change was based on computer models. I hadn't realized it was based on concrete measurements of what the paleoclimates -- the ancient climates -- were, as recorded in the ice sheets, as recorded in deep ocean sediments, as recorded in lake sediments, tree rings, and a lot of other ways of measuring temperature.
When I realized that climate change was real, and it was not based on computer models, I decided that one day I would do a project looking at trying to manifest climate change photographically. And that led me to this project. Initially, I was working on a National Geographic assignment -- conventional, single frame, still photography. And one crazy day, I got the idea that I should -- after that assignment was finished -- I got the idea that I should shoot in time-lapse photography, that I should station a camera or two at a glacier and let it shoot every 15 minutes, or every hour or whatever and watch the progression of the landscape over time.
Well, within about three weeks, I incautiously turned that idea of a couple of time-lapse cameras into 25 time-lapse cameras. And the next six months of my life were the hardest time in my career, trying to design, build and deploy out in the field these 25 time-lapse cameras. They are powered by the sun. Solar panels power them. Power goes into a battery. There is a custom made computer that tells the camera when to fire. And these cameras are positioned on rocks on the sides of the glaciers, and they look in on the glacier from permanent, bedrock positions, and they watch the evolution of the landscape. We just had a number of cameras out on the Greenland Ice Sheet. We actually drilled holes into the ice, way deep down below the thawing level, and had some cameras out there for the past month and a half or so. Actually, there's still a camera out there right now. In any case, the cameras shoot roughly every hour. Some of them shoot every half hour, every 15 minutes, every five minutes.
Here's a time lapse of one of the time-lapse units being made. (Laughter) I personally obsessed about every nut, bolt and washer in these crazy things. I spent half my life at our local hardware store during the months when we built these units originally.
We're working in most of the major glaciated regions of the northern hemisphere. Our time-lapse units are in Alaska, the Rockies, Greenland and Iceland, and we have repeat photography positions, that is places we just visit on an annual basis, in British Columbia, the Alps and Bolivia.
It's a big undertaking. I stand here before you tonight as an ambassador for my whole team. There's a lot of people working on this right now. We've got 33 cameras out this moment. We just had 33 cameras shoot about half an hour ago all across the northern hemisphere, watching what's happened. And we've spent a lot of time in the field. It's been a fantastic amount of work. We've been out for two and a half years, and we've got about another two and a half years yet to go.
That's only half our job. The other half of our job is to tell the story to the global public. You know, scientists have collected this kind of information off and on over the years, but a lot of it stays within the science community. Similarly, a lot of art projects stay in the art community, and I feel very much a responsibility through mechanisms like TED, and like our relationship with the Obama White House, with the Senate, with John Kerry, to influence policy as much as possible with these pictures as well. We've done films. We've done books. We have more coming. We have a site on Google Earth that Google Earth was generous enough to give us, and so forth, because we feel very much the need to tell this story, because it is such an immediate evidence of ongoing climate change right now.
Now,one bit of science before we get into the visuals. If everybody in the developed world understood this graph, and emblazoned it on the inside of their foreheads, there would be no further societal argument about climate change because this is the story that counts. Everything else you hear is just propaganda and confusion. Key issues: this is a 400,000 year record. This exact same pattern is seen going back now almost a million years before our current time. And several things are important.
Number one: temperature and carbon dioxide in the atmosphere go up and down basically in sync. You can see that from the orange line and the blue line. Nature naturally has allowed carbon dioxide to go up to 280 parts per million. That's the natural cycle. Goes up to 280 and then drops for various reasons that aren't important to discuss right here. But 280 is the peak. Right now, if you look at the top right part of that graph, we're at 385 parts per million. We are way, way outside the normal, natural variability. Earth is having a fever. In the past hundred years, the temperature of the Earth has gone up 1.3 degrees Fahrenheit,.75 degrees Celsius, and it's going to keep going up because we keep dumping fossil fuels into the atmosphere. At the rate of about two and a half parts per million per year. It's been a remorseless, steady increase.
We have to turn that around. That's the crux, and someday I hope to emblazon that across Times Square in New York and a lot of other places. But anyway, off to the world of ice.
We're now at the Columbia Glacier in Alaska. This is a view of what's called the calving face. This is what one of our cameras saw over the course of a few months. You see the glacier flowing in from the right, dropping off into the sea, camera shooting every hour. If you look in the middle background, you can see the calving face bobbing up and down like a yo-yo. That means that glacier's floating and it's unstable, and you're about to see the consequences of that floating. To give you a little bit of a sense of scale, that calving face in this picture is about 325 feet tall. That's 32 stories. This is not a little cliff. This is like a major office building in an urban center. The calving face is the wall where the visible ice breaks off, but in fact, it goes down below sea level another couple thousand feet. So there's a wall of ice a couple thousand feet deep going down to bedrock if the glacier's grounded on bedrock, and floating if it isn't.
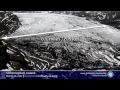
Here's what Columbia's done. This is in south central Alaska. This was an aerial picture I did one day in June three years ago. This is an aerial picture we did this year. That's the retreat of this glacier. The main stem, the main flow of the glacier is coming from the right and it's going very rapidly up that stem. We're going to be up there in just a few more weeks, and we expect that it's probably retreated another half a mile, but if I got there and discovered that it had collapsed and it was five miles further back, I wouldn't be the least bit surprised.
Now it's really hard to grasp the scale of these places, because as the glaciers -- one of the things is that places like Alaska and Greenland are huge, they're not normal landscapes -- but as the glaciers are retreating, they're also deflating, like air is being let out of a balloon. And so, there are features on this landscape. There's a ridge right in the middle of the picture, up above where that arrow comes in, that shows you that a little bit. There's a marker line called the trim line above our little red illustration there. This is something no self-respecting photographer would ever do -- you put some cheesy illustration on your shot, right? -- and yet you have to do it sometimes to narrate these points. But, in any case, the deflation of this glacier since 1984 has been higher than the Eiffel Tower, higher than the Empire State Building.
A tremendous amount of ice has been let out of these valleys as it's retreated and deflated, gone back up valley. These changes in the alpine world are accelerating. It's not static. Particularly in the world of sea ice, the rate of natural change is outstripping predictions of just a few years ago, and the processes either are accelerating or the predictions were too low to begin with. But in any case, there are big, big changes happening as we speak.
So, here's another time-lapse shot of Columbia. And you see where it ended in these various spring days, June, May, then October. Now we turn on our time lapse. This camera was shooting every hour. Geologic process in action here. And everybody says, well don't they advance in the winter time? No. It was retreating through the winter because it's an unhealthy glacier. Finally catches up to itself, it advances.
And you can look at these pictures over and over again because there's such a strange, bizarre fascination in seeing these things you don't normally get to see come alive. We've been talking about "seeing is believing "and seeing the unseen at TED Global. That's what you see with these cameras. The images make the invisible visible. These huge crevasses open up. These great ice islands break off -- and now watch this. This has been the springtime this year -- a huge collapse. That happened in about a month, the loss of all that ice.
So that's where we started three years ago, way out on the left, and that's where we were a few months ago, the last time we went into Columbia. To give you a feeling for the scale of the retreat, we did another cheesy illustration, with British double-decker buses. If you line up 295 of those nose to tail, that's about how far back that was. It's a long way.
On up to Iceland. One of my favorite glaciers, the Solheimajokull. And here, if you watch, you can see the terminus retreating. You can see this river being formed. You can see it deflating. Without the photographic process, you would never see this. This is invisible. You can stand up there your whole life and you would never see this, but the camera records it.
So we wind time backwards now. We go back a couple years in time. That's where it started. That's where it ended a few months ago.
And on up to Greenland. The smaller the ice mass, the faster it responds to climate. Greenland took a little while to start reacting to the warming climate of the past century, but it really started galloping along about 20 years ago. And there's been a tremendous increase in the temperature up there.
It's a big place. That's all ice. All those colors are ice and it goes up to about two miles thick, just a gigantic dome that comes in from the coast and rises in the middle. The one glacier up in Greenland that puts more ice into the global ocean than all the other glaciers in the northern hemisphere combined is the Ilulissat Glacier.
We have some cameras on the south edge of the Ilulissat, watching the calving face as it goes through this dramatic retreat. Here's a two-year record of what that looks like. Helicopter in front of the calving face for scale, quickly dwarfed. The calving face is four and a half miles across, and in this shot, as we pull back, you're only seeing about a mile and a half. So, imagine how big this is and how much ice is charging out. The interior of Greenland is to the right. It's flowing out to the Atlantic Ocean on the left. Icebergs, many, many, many, many times the size of this building, are roaring out to sea.
We just downloaded these pictures a couple weeks ago, as you can see. June 25th, monster calving events happened. I'll show you one of those in a second.
This glacier has doubled its flow speed in the past 15 years. It now goes at 125 feet a day, dumping all this ice into the ocean. It tends to go in these pulses, about every three days, but on average,125 feet a day, twice the rate it did 20 years ago.
Okay. We had a team out watching this glacier, and we recorded the biggest calving event that's ever been put on film. We had nine cameras going. This is what a couple of the cameras saw. A 400-foot-tall calving face breaking off. Huge icebergs rolling over. Okay, how big was that? It's hard to get it. So an illustration again, gives you a feeling for scale. A mile of retreat in 75 minutes across the calving face, in that particular event,three miles wide. The block was three-fifths of a mile deep, and if you compare the expanse of the calving face to the Tower Bridge in London, about 20 bridges wide. Or if you take an American reference, to the U.S. Capitol Building and you pack 3,000 Capitol Buildings into that block, it would be equivalent to how large that block was. 75 minutes.
Now I've come to the conclusion after spending a lot of time in this climate change world that we don't have a problem of economics, technology and public policy. We have a problem of perception. The policy and the economics and the technology are serious enough issues, but we actually can deal with them. I'm certain that we can. But what we have is a perception problem because not enough people really get it yet. You're an elite audience. You get it. Fortunately, a lot of the political leaders in the major countries of the world are an elite audience that for the most part gets it now. But we still need to bring a lot of people along with us. And that's where I think organizations like TED, like the Extreme Ice Survey can have a terrific impact on human perception and bring us along. Because I believe we have an opportunity right now.
We are nearly on the edge of a crisis, but we still have an opportunity to face the greatest challenge of our generation and, in fact, of our century. This is a terrific, terrific call to arms to do the right thing for ourselves and for the future. I hope that we have the wisdom to let the angels of our better nature rise to the occasion and do what needs to be done. Thank you.
(Applause)
たいていの場合、科学と芸術は 相互不理解の両側で互いを見交わしています 互いを見ると大きな混乱が生まれます もちろん芸術は、世界を精神、感情ー 時には無意識の場合もありますが―それに美意識から見ています 科学は、世界を合理性や定量性― 測定や記述が可能なものから見ていますが 理解のための驚くべき枠組みも芸術へ提供します
「Extreme Ice Survey」で、我々は 人間の理解の、これら二つの領域を組み合わせ 芸術と科学を融合し 自然と人間との関わりを理解する 助けとする事を目標としました 特に、生涯にわたり プロの自然写真家として過ごし、私は 写真、ビデオ、映画には 自然および人間と自然の関係を 理解するのを助ける 強大な力があると確信しています
このプロジェクトではもちろん、氷に特別の関心がありました 氷の美と、変形する力、 その変形許容力 それが取り得る驚くべき形に魅了されました 最初の写真はグリーンランドのものです しかし氷には別の意味があります 氷は地球全体の「炭坑のカナリア」なのです そこでは気候変動の実際を見て、触れて、聞いて、感じることができます
世界の大部分では、気候変動はとても抽象的です 信じるにせよ信じないにせよ、自分の感覚に頼って 前より雨が多いとか少ないとか、あるいは 気温が徐々に上がっているとか下がっているとか言っています あるいはコンピュータモデルがこう言っているとかいないとか、他の測定値がどうとかです そんなものは全て横に置いてください 地球の極地あるいは高所環境には 氷があり、気候変動はそこでは現実なのです 変化は起こっています 実に目に見える形で 撮影できるし、測定できるのです
世界の氷河の95%は、後退し縮小しています これは南極の周辺です 95%の氷河は後退し、縮小しているのです 降雪パターンと気温パターンが変化しているからです このことについて科学的議論の余地はありません 観察され、測定されている 絶対確実な情報です 現代の大きな皮肉あるいは悲劇は 科学者がまだこの真否を議論していると、一般大衆が思っている事です 科学はそのことを議論していません お見せする写真では、何十万年の歴史を持つ 莫大な氷河や氷床が 塊となって壊れて行き 氷山が一つづつ流れ去り、海面上昇へと変貌しています
30年間のキャリアにわたってこれを見ていながら 10年ほど前まで、私はまだ気候変動には懐疑的でした 気候変動はコンピュータモデルに基づいていると思っていたからです 実際はそれが、氷床や、海洋底の沈殿物や、 湖の沈殿物や、年輪やその他の 気温を測定する方法に基づいた「古気象」―古代の気象ーの 確固とした測定によるとは 知りませんでした
気候変動がコンピュータモデルに基づいたものでなく現実だと知った時 自分がいつか、気候変動を写真の形で捉え 表現するプロジェクトを行おうと思いました そしてこのプロジェクトにたどり着いたのです 当初私は、ナショナルジオグラフィック誌の仕事で 通常の、一枚ものの静止画写真を撮影していました そしてある日、突飛な考えがひらめき この仕事が終わったら コマ落とし撮影用のカメラを 一つか二つ、氷河の近くに設置し 15分おきか、1時間おきか、それくらいの時間で撮影し 風景がどう変化するかを見てみようと思いました
それからまあ3週間で 身の程知らずにも、計画したカメラの数を 25個にしました それから半年は、人生で最高にきつい時期で 25台のコマ落とし撮影カメラを設計し、組み立てては設置することになりました 動力源は太陽です 太陽電池で駆動します バッテリーに充電します いつ撮影するかを制御する 特製のコンピュータもあります カメラは氷河の側面の岩に設置され 岩盤上の動かない位置から氷河を見下ろし 風景の進化を見続けるのです ちょうどグリーンランド氷床にカメラをいくつか設置したところです ここ6週間ほどは、ドリルで氷に穴をあけ、解氷レベルの下にまで行き そこにカメラを設置してきました 今もカメラはそこにあります とにかく、カメラはだいたい1時間おきか 30分おき、15分おき、5分おきくらいで撮影します
これがコマ落とし撮影カメラ制作過程のコマ落とし撮影です (笑) こういう物のナットやボルトやワッシャには特別こだわりがあります こいういう機材をオリジナルで作るときは 生活の半分くらいを地元の工具店で過ごします
我々は北半球の殆どの主要な氷河で作業しました コマ落とし撮影カメラはアラスカ、ロッキー山脈、グリーンランド、アイスランドにあり いつも行く撮影場所 つまり毎年の様に訪れる場所があり ブリティッシュコロンビア、アルプス、ボリビアなどです
大きな仕事です 私は今夜ここに 全チームの代表として来ています 現在この作業に従事している人がたくさんいます カメラは今33台あります 30分前に、北半球全域の33台のカメラで 撮影があり、何が起きているかを見ているのです 長時間、現場で過ごしています 大変な作業量です 2年半続けてきていて あとまだ2年半続く予定です
それでも仕事の一方に過ぎません もう一方の仕事は、世界の人々にこの話をすることです 科学者たちは、この手の情報を年間を通じて 適時集めていますが、多くは科学の世界に留まっています 同様に、多くのプロジェクトが芸術の世界だけに留まっている そして私は、たとえばTEDや、あるいは オバマ政権や、議会や、ジョン・ケリーのオフィスとの 関係を通じて、これらの写真で政策に 最大限の影響を及ぼす責任があると感じています 映画も作った 本も書いた さらにもっとやる事がある グーグルアースにサイトがあります 親切なグーグルアースが提供してくれました― 今現在、進行しつつある気候変動の直接の証拠である この物語を広める必要があるからです
さて、映像を見る前にちょっとだけ科学の勉強です もし先進国の全員がこのグラフを理解し 頭に刻み込めば 事の重大さにより、いまさら気候変動についてとやかくいう 議論はなくなるでしょう これ以外はすべて、ただのプロパガンダと混乱です 鍵はこれです:これは40万年分の記録です 今から約100万年前にもこれと同じパターンが 起きました 重要なことがいくつかあります
一つ:気温と大気中の二酸化炭素の量は だいたい同期しています オレンジと青の線でそれがわかります 自然界では、最大280ppmの二酸化炭素までは許容されます それが自然のサイクルです 280までくるとそれから下がる その様々な理由については今は重要ではありません 280がピークです ちょうど現在、グラフの右上端を見れば 今は385ppmです 正常な自然の変動領域から、遥かに遠く外れているんです 地球が熱発しているんです ここ100年間で地球の気温は 華氏で1.3度、摂氏で0.75度上昇し さらに上昇中です 我々が化石燃料を大気に放出しているからです 年間2.5ppmのスピードで、です 容赦なく上昇し続けています
引き返さなくてはなりません それが鍵です いつかニューヨークのタイムズスクエアなどの場所に それを堂々と掲げられればいいと思っています しかしとにかく、氷の世界に行ってみましょう
アラスカのコロンビア氷河です これが氷塊分離面の景色です カメラが数カ月間にわたって観察したものです 氷河は右から流れ込んで 海に落ち込みます カメラは毎時間撮影しています 真ん中後ろあたりを見ると 氷塊分離面がヨーヨーのように上下しているのがわかります つまり氷河が浮いていて不安定だということで、 その浮遊の結果がこれからわかります この大きさですが 写真の氷塊分離面は 高さ100メートル、32階くらいあります 小さな崖程度ではなく、都市中心部のオフィスビルくらいあるわけです 氷塊分離面では氷が崩れるのが目に見えるわけですが 実は水面下に600メートルほど、さらに広がっています つまり深さ600メートルの氷の壁が もしも氷河が岩盤にあればそこまで崩れ落ちるし、 そうでなければ流れ去っているのです
コロンビア氷河は終わり こちらは中央アラスカの南部です この空撮写真は、3年前の6月に、私が撮影したものです こちらは今年撮影したものです 氷河が後退しています 本流、つまり氷河の本体は右側からやってきていますが 急速に上流へと後退しています 数週間後にそこに行くのですが おそらくあと800メートルは後退しているでしょう しかし、もし私があそこまで行ってみて さらに8キロ後退していても、全く驚かないでしょう
こういう場所の規模感をつかむのは本当に難しいです なぜなら氷河は― アラスカやグリーンランドの様な場所はとても巨大で 通常の風景ではないんです― 氷河は後退しているだけでなく、縮小していて まるで風船がしぼんでいくようです それで、この氷河には特徴があります 写真の真ん中、矢印がついているその上に「尾根」が見えます それが理解の助けになるでしょう 「トリムライン(掘削線)」と呼ばれる目印の線があります 赤い線が引いてあるところです 自尊心のある写真家ならまずやらないんですが― ちょっとチャチなイラストを入れてますが まあ説明をはっきり分かってもらうためです それで、1984年以来の氷河の縮小は エッフェル塔よりも、エンパイアステートビルよりも規模が大きいのです
氷河が後退し縮小するにつれて、膨大な量の氷が この谷から流出してしまったのです 高山地方のこういう変化は加速しています 静的ではありません 特に海氷の世界では 自然の変化は数年前の予想を遥かに上回っており 状況は加速しているか、あるいは 当初の推測自体が過小に過ぎたのです いずれにせよ、こうして話している間にも、ものすごく大規模な変化が起きています
こちらはコロンビア氷河での別のコマ落とし撮影映像です 氷河が春、6月、5月、10月と、 どこまで来ているかがわかります さて、コマを動かします 1時間に1回、撮影しています 地質学的規模の出来事です 冬には進行してないじゃないか、と皆が言います ちがいます これは「不健康な」氷河で、冬を通じて後退しています 最後には追いついて、後退して行きます
こういう映像は何度も見てしまいます 普通、動くはずのないものが動くのを見るのは とても奇妙な魅力があるからです 百聞は一見にしかずで、そういうものを TEDグローバルで見ているわけです こういうカメラだから見ることができます 見えないものが見えている 大きなクレバスが開いています 大きな氷の島が流れていきます これを見てください これは今年の春です 巨大な崩壊です 1ヶ月ほどで起きて これだけの氷が失われました
つまり3年前に記録し始めたところは ずっと左の先の方で、こちらが数ヶ月前に、我々が 最後にコロンビア氷河に行った時のものです 後退の規模感をお示しするために またちょっとイラストを使います イギリスの二階建てバスです 後退した場所まで、二階建でバスが295台、縦に並べられます ものすごい距離です
アイスランドです 私の好きな場所の一つ、ソウルヘイマヨークトル氷河です 見ていると、氷河末端が後退していくのがわかります 川ができ、 縮小していきます 写真という手段がなければ、絶対に見ることができません 見られないのです 一生ここに立っていても見えないでしょう カメラだからできる
逆回しにします 2年時間をさかのぼる ここから始まり、 数ヶ月前にここで終わっています
グリーンランドです 氷の量が少ないほど、気候変動の影響が早く現れます グリーンランドは、前世紀の温暖化への反応には いくらか時間がかかりました しかしここ20年間、その勢いが加速しています あの場所の気温はものすごく上昇しています
大きな場所です すべてが氷 色のついているのはすべて氷で、厚さが3キロ以上あり、 海岸から流れ込み、中央が盛り上がった巨大なドームです グリーンランドには 北半球の他のすべての氷河を合わせたより 多くの氷を海に流している氷河があります イルリサット氷河です
我々のカメラがいくつか、イルリサットの南縁にあり この劇的な後退を、氷塊分離面から撮影しています 2年前の光景はこんな様子でした 正面部分にあるヘリコプターでスケールがわかります どんどん小さくなっていきます 正面の幅は7キロメートル以上あります カメラを引いていきますが、それでも2.4キロメートル分しか見えていません どれくらい巨大か、また どれだけの氷が流れているか想像してみてください グリーランド内陸は右側です 左の大西洋へ向けて流れています ビルの何十倍もある氷山が、音を立てて海に落ち込んでいます
2週間前、6月25日に 大規模な崩壊現場の写真を ダウンロードしました もうすぐご覧に入れます
過去15年で、氷河の流速が2倍になりました 一日に40メートル強の氷が、海に流れ落ちています 3日おきに、脈動するように落ちて行きますが 平均すると毎日40メートル強で 20年前の倍の速度です
それで、この氷河を観察するチームが 映像記録史上、最大の崩壊イベントを記録しました 9台のカメラが回っています そのうち2台が記録しました 高さ130メートルの氷が剥がれ落ちます ものすごく巨大な氷山が流れ出していきます さて、どれくらい大きかったのか? 想像し難いものです イラストをもう一度 規模がわかるでしょう 75分で(およそ)1.6キロの後退 この一回の放出で、崩壊幅が4.8キロメートル ブロックの高さが800メートル 崩壊面の幅をロンドン橋と比べると 橋20個分の長さになります アメリカ式に言うと、米国議会議事堂だと 氷塊の中に3000個分 どれくらい巨大がかわかるでしょう たった75分の出来事です
さて、気候変動について 長い間学んだ私の結論は 事は経済上、技術上、あるいは政策の問題ではない、ということです 問題は「認知」なのです 政治も経済も技術も十分すぎる問題ですが それは解決することができる 必ずできるでしょう しかしここには認知の問題があって 多くの人々は、事の重大さをまだ理解していないのです こちらの聴衆の皆さんはエリートです だから理解できる 幸運にも、世界の主要な諸国の政治指導者の多くは これを理解できるエリートの聞き手です しかしもっと多くの人々に仲間になってもらわなくてはなりません そのために、TEDのような組織や Extreme Ice Surveyなどが、人間の認知に大きな影響を与え 共に行動するようにできるのです なぜなら、まさしく今がチャンスだと思うからです
我々は危機の瀬戸際にいながら それでもこの世代、あるいは今世紀最大の脅威に 立ち向かえる機会があるのです 我々と、未来のために 正しいことをするための召集がかかっています 私たちの英知が、この機に我々の良心を 目覚めさせ、なすべきことをなさしめる事を期待します どうもありがとう
(拍手)
品詞分類
- 主語
- 動詞
- 助動詞
- 準動詞
- 関係詞等
TED 日本語
TED Talks
関連動画

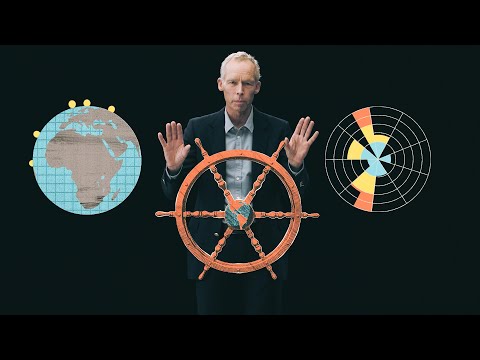
人類の未来を変革する10年 あるいは地球が不安定化する10年ヨハン・ロックストローム
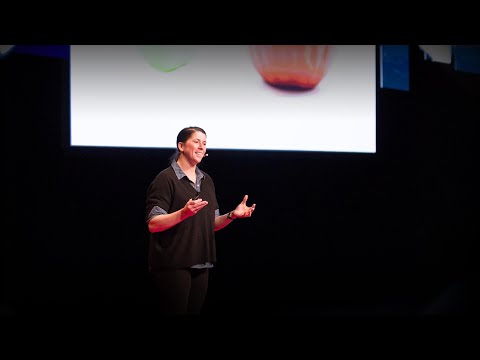
2020.10.15ビッグデータと小規模農場と2つのトマトの物語エリン・バウムガートナー
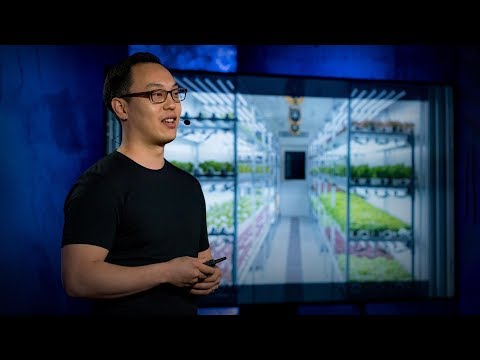
2020.09.11屋内垂直農場が農業の未来なのか?スチュアート・オダ
2020.02.07新しい政治の物語はすべてを変えられるジョージ・モンビオ
2019.09.05一過性の都市に見る驚異の建築術ラフール・メロトラ
2019.08.29政治家をあるものに置き換える大胆な構想セザー・ヒダルゴ
2019.04.03気候のための行動への心開かれる訴え | TED Talkグレタ・サンバーグ
おすすめ 12019.02.13気候変動に対してあなたが出来るいちばん大事なことキャサリン・ヘイホー
2019.01.11何をやるときにも自分に問う3つの質問ステイシー・エイブラムス
2019.01.08子供たちに学ぶ都市計画マーラ・ミンツァー
2018.11.28テクノロジー企業があなたを欺いてデータとプライバシーを放棄させる手口フィン・リュツォー=ホルム・ミスタッド
2018.11.21街の東側に貧困地域が多いのはなぜかスティーブン・デベリー
2018.09.12無人操縦エアタクシーが移動方法をどう変えるかロディン・リアソフ
2018.07.20悪夢のような子供向けYouTube動画 ― 今のインターネットのどこが間違っているのかジェームズ・ブライドル
2018.07.13もしも無作為に選ばれた人たちが政治家になったら - TED Talkブレット・ヘニッヒ
2018.06.26オンラインの嫌がらせコメントから、オフラインの建設的な対話を生む方法ディラン・マロン
2018.05.18


洋楽 おすすめ
RECOMMENDS
洋楽歌詞
ダイナマイトビーティーエス
洋楽最新ヒット2020.08.20ディス・イズ・ミーグレイテスト・ショーマン・キャスト
洋楽人気動画2018.01.11グッド・ライフGイージー、ケラーニ
洋楽人気動画2017.01.27ホワット・ドゥ・ユー・ミーン?ジャスティン・ビーバー
洋楽人気動画2015.08.28ファイト・ソングレイチェル・プラッテン
洋楽人気動画2015.05.19ラヴ・ミー・ライク・ユー・ドゥエリー・ゴールディング
洋楽人気動画2015.01.22アップタウン・ファンクブルーノ・マーズ、マーク・ロンソン
洋楽人気動画2014.11.20ブレイク・フリーアリアナ・グランデ
洋楽人気動画2014.08.12ハッピーファレル・ウィリアムス
ポップス2014.01.08カウンティング・スターズワンリパブリック
ロック2013.05.31ア・サウザンド・イヤーズクリスティーナ・ペリー
洋楽人気動画2011.10.26ユー・レイズ・ミー・アップケルティック・ウーマン
洋楽人気動画2008.05.30ルーズ・ユアセルフエミネム
洋楽人気動画2008.02.21ドント・ノー・ホワイノラ・ジョーンズ
洋楽人気動画2008.02.15オンリー・タイムエンヤ
洋楽人気動画2007.10.03ミス・ア・シングエアロスミス
ロック2007.08.18タイム・トゥ・セイ・グッバイサラ・ブライトマン
洋楽人気動画2007.06.08シェイプ・オブ・マイ・ハートスティング
洋楽人気動画2007.03.18ウィ・アー・ザ・ワールド(U.S.A. フォー・アフリカ)マイケル・ジャクソン
洋楽人気動画2006.05.14ホテル・カリフォルニアイーグルス
ロック2005.07.06