TED日本語
TED Talks(英語 日本語字幕付き動画)
TED日本語 - ルーク・デュボワ: データで描く、示唆に富む肖像画
TED Talks
データで描く、示唆に富む肖像画
Insightful human portraits made from data
ルーク・デュボワ
R. Luke DuBois
内容
アーティストであるルーク・デュボワは、データとその特徴を使い、歴代大統領や都市、彼自身やブリトニー・スピアーズのユニークな肖像画を生み出しています。出会い系サイトにおける何百万人ものプロフィール情報を利用して生み出したアメリカ地図から、ニューオーリンズで発砲が起きる毎に空砲を放つ拳銃まで、彼はこのトークで9つのプロジェクトを紹介します。「どのように技術を使うかは、我々と我々の文化を表している。人間を統計的に処理する事は危険である。」彼はそう締め括ります。


字幕
SCRIPT
Script
So I'm an artist, but a little bit of a peculiar one. I don't paint. I can't draw. My shop teacher in high school wrote that I was a menace on my report card. You probably don't really want to see my photographs. But there is one thing I know how to do: I know how to program a computer. I can code.
And people will tell me that 100 years ago, folks like me didn't exist, that it was impossible, that art made with data is a new thing, it's a product of our age, it's something that's really important to think of as something that's very "now." And that's true.
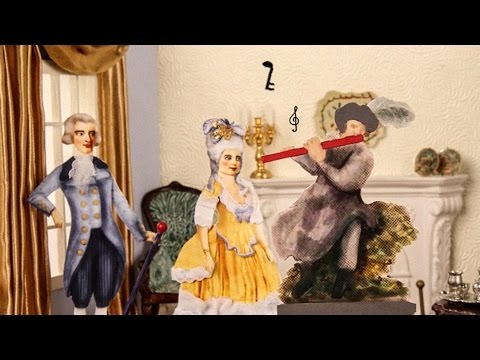
But there is an art form that's been around for a very long time that's really about using information, abstract information, to make emotionally resonant pieces. And it's called music. We've been making music for tens of thousands of years, right? And if you think about what music is -- notes and chords and keys and harmonies and melodies -- these things are algorithms. These things are systems that are designed to unfold over time, to make us feel. I came to the arts through music. I was trained as a composer, and about 15 years ago, I started making pieces that were designed to look at the intersection between sound and image, to use an image to unveil a musical structure or to use a sound to show you something interesting about something that's usually pictorial.
So what you're seeing on the screen is literally being drawn by the musical structure of the musicians onstage, and there's no accident that it looks like a plant, because the underlying algorithmic biology of the plant is what informed the musical structure in the first place. So once you know how to do this, once you know how to code with media, you can do some pretty cool stuff.
This is a project I did for the Sundance Film Festival. Really simple idea: you take every Academy Award Best Picture, you speed it up to one minute each and string them all together. And so in 75 minutes, I can show you the history of Hollywood cinema. And what it really shows you is the history of editing in Hollywood cinema. So on the left, we've got Casablanca; on the right, we've got Chicago. And you can see that Casablanca is a little easier to read. That's because the average length of a cinematic shot in the 1940s was 26 seconds, and now it's around six seconds.
This is a project that was inspired by some work that was funded by the US Federal Government in the early 2000s, to look at video footage and find a specific actor in any video. And so I repurposed this code to train a system on one person in our culture who would never need to be surveilled in that manner, which is Britney Spears. I downloaded 2,000 paparazzi photos of Britney Spears and trained my computer to find her face and her face alone. I can run any footage of her through it and will center her eyes in the frame, and this sort of is a little double commentary about surveillance in our society. We are very fraught with anxiety about being watched, but then we obsess over celebrity.
What you're seeing on the screen here is a collaboration I did with an artist named Lian Amaris. What she did is very simple to explain and describe, but very hard to do. She took 72 minutes of activity, getting ready for a night out on the town, and stretched it over three days and performed it on a traffic island in slow motion in New York City. I was there, too, with a film crew. We filmed the whole thing, and then we reversed the process, speeding it up to 72 minutes again, so it looks like she's moving normally and the whole world is flying by.
At a certain point, I figured out that what I was doing was making portraits. When you think about portraiture, you tend to think about stuff like this. The guy on the left is named Gilbert Stuart. He's sort of the first real portraitist of the United States. And on the right is his portrait of George Washington from 1796. This is the so-called Lansdowne portrait. And if you look at this painting, there's a lot of symbolism, right? We've got a rainbow out the window. We've got a sword. We've got a quill on the desk. All of these things are meant to evoke George Washington as the father of the nation.
This is my portrait of George Washington. And this is an eye chart, only instead of letters, they're words. And what the words are is the 66 words in George Washington's State of the Union addresses that he uses more than any other president. So "gentlemen" has its own symbolism and its own rhetoric. And it's really kind of significant that that's the word he used the most. This is the eye chart for George W. Bush, who was president when I made this piece. And how you get there, from "gentlemen" to "terror" in 43 easy steps, tells us a lot about American history, and gives you a different insight than you would have looking at a series of paintings. These pieces provide a history lesson of the United States through the political rhetoric of its leaders. Ronald Reagan spent a lot of time talking about deficits. Bill Clinton spent a lot of time talking about the century in which he would no longer be president, but maybe his wife would be. Lyndon Johnson was the first President to give his State of the Union addresses on prime-time television; he began every paragraph with the word "tonight." And Richard Nixon, or more accurately, his speechwriter, a guy named William Safire, spent a lot of time thinking about language and making sure that his boss portrayed a rhetoric of honesty.
This project is shown as a series of monolithic sculptures. It's an outdoor series of light boxes. And it's important to note that they're to scale, so if you stand 20 feet back and you can read between those two black lines, you have 20/20 vision.
(Laughter)
This is a portrait. And there's a lot of these. There's a lot of ways to do this with data. I started looking for a way to think about how I can do a more democratic form of portraiture, something that's more about my country and how it works. Every 10 years, we make a census in the United States. We literally count people, find out who lives where, what kind of jobs we've got, the language we speak at home. And this is important stuff -- really important stuff. But it doesn't really tell us who we are. It doesn't tell us about our dreams and our aspirations.
And so in 2010, I decided to make my own census. And I started looking for a corpus of data that had a lot of descriptions written by ordinary Americans. And it turns out that there is such a corpus of data that's just sitting there for the taking. It's called online dating.
So in 2010, I joined 21 different online dating services, as a gay man, a straight man, a gay woman and a straight woman, in every zip code in America and downloaded about 19 million people's dating profiles -- about 20 percent of the adult population of the United States. I have obsessive-compulsive disorder. This is going to become really freaking obvious. Just go with me.
(Laughter)
So what I did was I sorted all this stuff by zip code. And I looked at word analysis. These are some dating profiles from 2010 with the word "lonely" highlighted. If you look at these things topographically, if you imagine dark colors to light colors are more use of the word, you can see that Appalachia is a pretty lonely place. You can also see that Nebraska ain't that funny. This is the kinky map, so what this is showing you is that the women in Alaska need to get together with the men in southern New Mexico, and have a good time. And I have this at a pretty granular level, so I can tell you that the men in the eastern half of Long Island are way more interested in being spanked than men in the western half of Long Island. This will be your one takeaway from this whole conference. You're going to remember that fact for, like,30 years.
(Laughter)
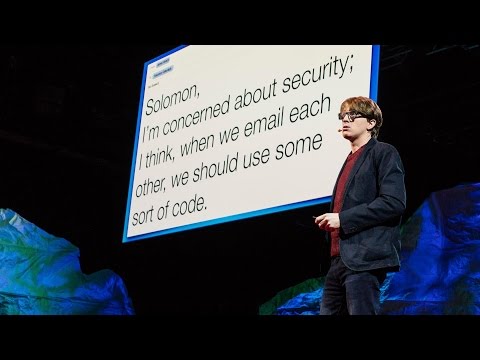
When you bring this down to a cartographic level, you can make maps and do the same trick I was doing with the eye charts. You can replace the name of every city in the United States with the word people use more in that city than anywhere else. If you've ever dated anyone from Seattle, this makes perfect sense. You've got "pretty." You've got "heartbreak." You've got "gig." You've got "cigarette." They play in a band and they smoke. And right above that you can see "email." That's Redmond, Washington, which is the headquarters of the Microsoft Corporation. Some of these you can guess -- so, Los Angeles is "acting" and San Francisco is "gay." Some are a little bit more heartbreaking. In Baton Rouge, they talk about being curvy; downstream in New Orleans, they still talk about the flood. Folks in the American capital will say they're interesting. People in Baltimore, Maryland, will say they're afraid. This is New Jersey. I grew up somewhere between "annoying" and "cynical."
And New York City's number one word is "now," as in, "Now I'm working as a waiter, but actually I'm an actor."
(Laughter)
Or, "Now I'm a professor of engineering at NYU, but actually I'm an artist." If you go upstate, you see "dinosaur." That's Syracuse. The best place to eat in Syracuse, New York, is a Hell's Angels barbecue joint called Dinosaur Barbecue. That's where you would take somebody on a date. I live somewhere between "unconditional" and "midsummer," in Midtown Manhattan. And this is gentrified North Brooklyn, so you've got "DJ" and "glamorous" and "hipsters" and "urbane." So that's maybe a more democratic portrait. And the idea was, what if we made red-state and blue-state maps based on what we want to do on a Friday night?
This is a self-portrait. This is based on my email, about 500,000 emails sent over 20 years. You can think of this as a quantified selfie. So what I'm doing is running a physics equation based on my personal data. You have to imagine everybody I've ever corresponded with. It started out in the middle and it exploded with a big bang. And everybody has gravity to one another, gravity based on how much they've been emailing, who they've been emailing with. And it also does sentimental analysis, so if I say "I love you," you're heavier to me. And you attract to my email addresses in the middle, which act like mainline stars. And all the names are handwritten.
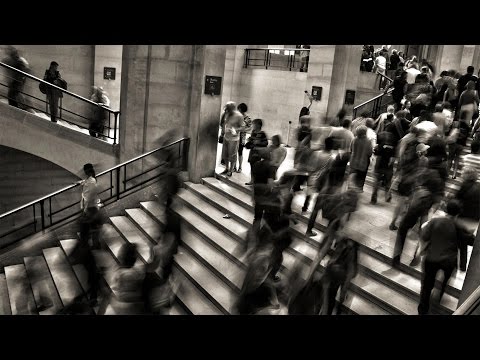
Sometimes you do this data and this work with real-time data to illuminate a specific problem in a specific city. This is a Walther PPK 9mm semiautomatic handgun that was used in a shooting in the French Quarter of New Orleans about two years ago on Valentine's Day in an argument over parking. Those are my cigarettes. This is the house where the shooting took place. This project involved a little bit of engineering. I've got a bike chain rigged up as a cam shaft, with a computer driving it. That computer and the mechanism are buried in a box. The gun's on top welded to a steel plate. There's a wire going through to the trigger, and the computer in the box is online. It's listening to the 911 feed of the New Orleans Police Department, so that anytime there's a shooting reported in New Orleans,
the gun fires. Now, there's a blank, so there's no bullet. There's big light, big noise and most importantly, there's a casing. There's about five shootings a day in New Orleans, so over the four months this piece was installed, the case filled up with bullets. You guys know what this is -- you call this "data visualization." When you do it right, it's illuminating. When you do it wrong, it's anesthetizing. It reduces people to numbers. So watch out.
One last piece for you. I spent the last summer as the artist in residence for Times Square. And Times Square in New York is literally the crossroads of the world. One of the things people don't notice about it is it's the most Instagrammed place on Earth. About every five seconds, someone commits a selfie in Times Square. That's 17,000 a day, and I have them all.
(Laughter)
These are some of them with their eyes centered.
Every civilization, will use the maximum level of technology available to make art. And it's the responsibility of the artist to ask questions about what that technology means and how it reflects our culture.
So I leave you with this: we're more than numbers. We're people, and we have dreams and ideas. And reducing us to statistics is something that's done at our peril.
Thank you very much.
(Applause)
私はアーティストですが 皆さんの想像とは違うかもしれません 絵は描きません というか描けません 高校の技術の先生は 私の成績表に「危険人物」 そうコメントしました 皆さんは私の作品を あまり見たくはないかもしれません ただ一つだけ 私にはできることがあります プログラミングです 私はコーディングできます
人々が口を揃えて言うのは 「100年前であれば 私のような データでアートを作る そんな人間は存在せず そういうものは今という 新しい時代の産物であり データを使ったアートとは つまり 新しいものとして考えるべきだ」 まあ間違いではありません
しかし実際はというと 遥か昔から 情報や抽象的概念を利用して 心に響く作品を生み出すという アートの形式自体は 存在していました 音楽の事です 私たち人類はもう何万年にも渡り 音楽を生み出してきました 音楽で思い浮かべるもの ― 音符、コード、調、ハーモニー、メロディー等は 全てアルゴリズムです これらは 時間とともに展開し 私たちの感情を呼び起こすよう 設計されたシステムなのです 私は音楽からアートの世界に来ました 作曲家だったわけですが およそ15年前から 作り始めたのが 音と映像の境界を意識するために デザインした作品です 映像を用いて 音楽的構造を解き明かしたり 普段は描かれるものを 音を使って何か面白く表現できないかと 考えたのです
今 ご覧いただいているのは ミュージシャンが舞台で奏でる ― 音楽の構造を そのまま絵にしたもので 見た目がまるで植物なのは 偶然ではありません 植物を表すアルゴリズムを使って 音楽の構造に意味付けをしているからです つまりメディアを利用した コードの方法さえ理解すれば 誰でも かなり良いものが作れます
これは サンダンス映画祭での 私のプロジェクトです 発想は単純です アカデミー賞作品賞の全受賞作品を それぞれ1分の映像へと短縮し そして全ての映像を繋げます こうすることで 75分で ハリウッド映画の歴史を見ることができます 映像が映し出したのは ハリウッド映画における 編集の歴史です 左の映像は『カサブランカ』 右のものは『シカゴ』です 『カサブランカ』の方が 何が起きているのか捉え易いはずです これは1940年代における ワンシーンの平均尺度が 26秒だった事に由来するのですが 今の映画の平均は6秒です
このプロジェクトは 監視カメラの映像を利用して 特定の人物を見つけるという 2000年代の始め 政府の支援の下で行われた活動に 着想を得たものです 私はこのコードを ある人物を特定するシステムに作り変えました 我々の文化で代表的な もはや監視される必要の無い人物 ブリトニー・スピアーズです 私はパパラッチの撮影した 2000枚に及ぶ彼女の写真をダウンロードし 彼女の顔だけを単体で見つける事のできる 解析ツールを構築しました 彼女の目を映像の中心に据えて 一連の場面を構成することができます これは私たちの監視社会に関して 二つの見方を提示しています 私たちは見られるという事に関して 不安を強く感じますが 一方でセレブリティーの事は 気になって仕方ないのです
今皆さんがご覧になっている作品は リアン・アマリスと 共同制作したものです 彼女が何をしているのか 口で言うのは簡単なのですが 実際にやるのは別次元です 夜の町へ繰り出す前の 一連の行動 時間にして 72分間のそのシーンを 彼女は3日間に引き伸ばし ニューヨークのど真ん中で スローモーションで演じたのです 私も撮影班と共にそこにいました 私たちは全てを録画し そして撮り終えた全工程を早回しし 今度は72分に短縮しました 車がまさに飛び交っているのに 彼女の動きが自然なのはその為です
そしてふと 私は気がつきました 私がやっているのは 肖像画を描くことだと 肖像画と聞いて思い浮かべるのは こういったものでしょう 左はギルバート・スチュアート 彼はアメリカで最初の 肖像画家と言えるでしょう そして右は彼の描いた 1796年のジョージ・ワシントンの肖像で 『ランズダウン』と呼ばれます シンボル化された多くものを この絵画に見ることができると思います 窓の外には虹が架かり 剣を携えているのがわかります テーブルに羽ペンもあります ここに描かれた全てが 建国の父 ジョージ・ワシントンを 想起させます
そして左が私の描いた ジョージ・ワシントンの肖像です これは視力検査表で 文字の代わりに 単語を並べています 66単語あるのですが それらは全て 一般教書演説の中で 彼が歴代大統領よりも 多く使った言葉です つまり「ジェントルマン」という言葉が 彼の修辞でありシンボルなのです この単語を 彼が最もよく使ったというのは かなり重要な意味を持つはずです そしてこれは 制作当時 大統領だった ジョージ・W・ブッシュの検査表です 考えてみてください 初代の「ジェントルマン」から 43代の「テロ」まで たどることが どれほどアメリカの歴史を私たちに伝え 一連の絵画を見た時とは違った 新しい気づきを もたらしてくれるのかを アメリカの指導者における 政治的レトリックを介して アメリカ史の変遷を 見て取ることができるのです ロナルド・レーガンは多くの時間を費やし 負債について語りました 一方でビル・クリントンは 自身はもはや大統領ではない 次の世紀について語りました 彼の妻がその座にいるかもしれないね リンドン・ジョンソンは 一般教書演説を 初めてゴールデンタイムに テレビ放映した大統領で 全ての段落を 「今晩(Tonight)」という言葉で始めました リチャード・ニクソン というよりも彼のスピーチライター ウィリアム・サファイアは ニクソンが誠実な言葉遣いをするよう 言葉の選択に 多くの時間を割いたのです
この企画は一連の 巨大な彫刻として展示されました 照明付きの箱を並べた野外展示です 重要なのは これが視力検査として機能しており 6メートル離れて 黒い線の間にある その言葉を読む事ができれば 視力良好ということです
(笑)
これは肖像画ですが 他にも まだまだあります データを用いてこうしたものを生み出す 多くの方法があります 私が模索し始めたのは どうすれば もっと民主的な形で 肖像画を作れるか この国と そのあり方を より表現する方法です 10年毎に この国では国勢調査が行われます 人口を文字通り数え 誰がどこに住み どんな仕事をして 家では何語を話すか 調べます 確かに大事で 欠かせないと思います しかし それでは 本当の姿は分かりません 夢や希望を伝えてはくれないのです
そこで2010年 私はオリジナルの国勢調査を始めます 一般的なアメリカ人によって書かれ より多くの描写がなされた そんな言語資料を求めていたのです そして見つけました そういう言語資料がもう山ほど すぐ目の前に転がっていたのです 出会い系サイトです
2010年 私は21の出会い系サイトに登録しました ゲイなど性的少数者を含めた あらゆる性別を用い アメリカの全ての郵便番号を駆使し そして1900万人もの プロフィールをダウンロードしました これはアメリカの 成人人口の20%に及びます 私は強迫性パーソナリティ障害です もう伝わってるかもしれませんが まあ聞いてください
(笑)
私がしたことは何かと言うと 郵便番号毎に全ての資料を整理し そして言語分析を試みたのです 2010年に入手した 幾つかのプロフィールがこれですが 「寂しい(Lonely)」という言葉が見て取れます これらをマッピングしてみます 明度が高ければ「寂しい」という言葉が より多く使われた事を意味するので アパラチアが 非常に寂しい場所であると わかるかと思います 「おもしろい(Funny)」を分析すると ネブラスカの人々は退屈そうです 「変態(Kinky)」という言葉の 地図から わかるのは アラスカの女性は 南部ニューメキシコの男性と 一緒になれば 楽しい時間を過ごせます ちなみに こうした分析を より仔細なレベルで見る事もでき ニューヨークの ロングアイランド東部の男性は ロングアイランド西部の男性よりも 遥かにお尻を叩かれたいと思っているようで 恐らく今日皆さんが覚えて帰るのは この情報だけでしょう この記憶だけは多分30年経っても 色褪せないでしょうね
(笑)
そしてこれらを 地図製作に応用すると 地図を使って さきほどの視覚検査表と 同じ事ができます アメリカ全土 それぞれの都市の名前を その地域で特徴的に使われている言葉で 置き換えてみましょう シアトル出身の方と付き合ったことがあれば お分かりになるでしょう ここにあるのは 「可愛い(Pretty)」「失恋(Heartbreak)」 「生演奏(Gig)」「タバコ(Cigarette)」等 彼らは演奏できて タバコを吸うらしいです さて目線を右に移すと 「eメール(Email)」とあります ワシントン州レドモンド マイクロソフトが本社を構える場所です 予測できるものも多いでしょう ロサンゼルスでは「演技(Acting)」 サンフランシスコでは「ゲイ(Gay)」 少し悲痛な例もあります バトンルージュでは 「太め(Curvy)」が語られる一方 下流のニューオーリンズでは いまだに「洪水(Flood)」が話題に上ります 首都に住む人は 「楽しい(Interesting)」と言い メリーランド州バルティモアの人々は 「恐れ(Afraid)」ています これはニュージャージーです 私は「面倒(Annoying)」と 「毒舌(Cynical)」の中間で育ちました
(笑)(拍手)
ニューヨークで最も使うのは 「今(Now)」です 「今はウェイトレスだけど本当は役者なの」 という時の「今」です
(笑)
「今はニューヨーク大学で工学の教授 でも本当はアーティスト」の「今」です 「恐竜(Dinasour)」 という文字が見えてきました ここはシラキュースです シラキュースで最も美味しいレストランは ヘルズ・エンジェルズが関係する 「ダイナソーBBQ」 ここは誰かとデートで行くようなところです 「完全な(Unconditional)」「真夏(Midsummer)」の間のミッドタウンに私は住んでいて 高級なノース・ブルックリンはこうです 「DJ」「魅力的(Glamorous)」「オシャレ(Hipsters)」「上品(Urbane)」 これは より民主的な肖像かもしれません つまり金曜日の夜に何をしたいのか それを基に 地図で可視化したらどうか という発想でした
これは自画像です 20年以上 50万通に及ぶ 自分のメールを解析して描きました 量的な自撮りとでも 考えてもらって構いません 個人情報に基づいて 物理の公式を運用する これが私のしている事です かつて私がやりとりした 全ての人々を 想像してください 中心から始まり そしてビックバンのように広がります 私たちには互いに引力が働いています どれほどメールを送ったか そして受け取ったか そのデータで定まる引力です 感情の側面からの分析もしています 「愛している」と伝えた人はより重要で 中央にある私のメールアドレスを ぐんと引き寄せ 大きな星の流れを作ります ちなみに 名前は全て手書きです
特定の都市における 特定の問題を描くという目的で リアルタイムで得られたデータを 作品に用いる事があります これはワルサーPPK セミオートマチックの9mm拳銃で ニューオーリンズ フレンチ・クオーターの銃撃で使われました 2年前のバレンタインデー 駐車をめぐる口論が引き金です 奥のタバコは私のものです この家が銃撃の現場でした この企画は 少しだけ機械工学を使っていますが バイクのチェーンで 回転軸をこしらえました コンピュータ制御です このコンピュータと装置一式は 箱の中に隠されます 拳銃は鉄板に上向きに溶接されており トリガーにワイヤーが引っ掛けられ 箱の中のコンピュータは 常にオンラインで ニューオーリンズ警察への911通報に反応し ニューオーリンズにおける 発砲の度に
(銃声)
銃声が鳴り響きます 空砲なので弾頭はありませんが 強い光と騒音は放たれます ケースに囲まれている事も忘れてはいけません ニューオーリンズでは 1日平均5度発砲があり 4ヶ月に渡って空砲弾がたまっていき ケースはそれで一杯になりました 皆さんもよくご存知の 「情報の可視化」です これは 正しく行えば問題を明瞭にしますが 誤って使えば 感覚を麻痺させます 人を数字に置き換えてしまうのです 気をつけてください
これが最後の作品です 昨年の夏 アーティスト・イン・レジデンスとしてタイムズ・スクエアで 過ごしました ニューヨークのタイムズ・スクエアといえば まさに世界の情報発信源ですが 地球上で最もインスタグラムに投稿される地点 それがタイムズ・スクエアだとは あまり知られていません 5秒毎にタイムズ・スクエアでは 誰かが自撮りをして それを投稿しています 1日17000枚に及ぶそれらの写真を 私は全部持っています
(笑)
顔が正面になっている自撮りを 選んでいます
全ての文明で 芸術は最高水準の技術を用いて 生み出されてきました そしてアーティストは 技術が何を意味するのか 文化が如何に映し出されているのか それらを問う責任を負っています
最後に ― 私たちは数字以上の存在です 我々は人間であり 夢やアイデアを持っています 人々を 統計データとして 処理してしまうこと それはあまりにも危険です
ありがとうございました
(拍手)
品詞分類
- 主語
- 動詞
- 助動詞
- 準動詞
- 関係詞等
TED 日本語
TED Talks
関連動画

アーティストは経済にどう貢献し、私たちは彼らをどう支えられるか?ハディ・エルデベック
2018.04.09コンテンツを流行らせる要素とは?ダオ・グエン
2018.01.08私がアートを制作するのは、伝統を受け継ぐタイムカプセルを作るためケイラ・ブリエット
2017.12.08ニューヨーカー誌、象徴的な表紙イラストの舞台裏フランソワーズ・ムーリー
2017.08.17とらえ難い心情を表す素敵な新語の数々ジョン・ケーニック
2017.03.312千本のおくやみ記事から学んだことラックス・ナラヤン
2017.03.23メロドラマが教えてくれる4つの大げさな人生訓ケイト・アダムス
2017.01.03音楽がもたらしたコンピューターの発明スティーヴン・ジョンソン
2016.12.09Ideas worth dating -- デートする価値のあるアイデアレイン・ウィルソン
2016.10.30購読解除の苦悩!ジェイムズ・ヴィーチ
2016.09.27コスプレへの愛アダム・サヴェッジ
2016.08.23「アンチ」を科学的に分類してみようネギン・ファルサド
2016.07.05詐欺メール 返信すると どうなるかジェイムズ・ヴィーチ
2016.02.01世界中の国の本を1冊ずつ読んでいく私の1年アン・モーガン
2015.12.21日常の音に隠された思いがけない美とはメクリト・ハデロ
2015.11.10アメリカで最も白人主義的な町々に突入!リッチ・ベンジャミン
2015.08.11
洋楽 おすすめ
RECOMMENDS
洋楽歌詞
ステイザ・キッド・ラロイ、ジャスティン・ビーバー
洋楽最新ヒット2021.08.20スピーチレス~心の声ナオミ・スコット
洋楽最新ヒット2019.05.23シェイプ・オブ・ユーエド・シーラン
洋楽人気動画2017.01.30フェイデッドアラン・ウォーカー
洋楽人気動画2015.12.03ウェイティング・フォー・ラヴアヴィーチー
洋楽人気動画2015.06.26シー・ユー・アゲインウィズ・カリファ
洋楽人気動画2015.04.06シュガーマルーン5
洋楽人気動画2015.01.14シェイク・イット・オフテイラー・スウィフト
ポップス2014.08.18オール・アバウト・ザット・ベースメーガン・トレイナー
ポップス2014.06.11ストーリー・オブ・マイ・ライフワン・ダイレクション
洋楽人気動画2013.11.03コール・ミー・メイビーカーリー・レイ・ジェプセン
洋楽人気動画2012.03.01美しき生命コールドプレイ
洋楽人気動画2008.08.04バッド・デイ~ついてない日の応援歌ダニエル・パウター
洋楽人気動画2008.05.14サウザンド・マイルズヴァネッサ・カールトン
洋楽人気動画2008.02.19イッツ・マイ・ライフボン・ジョヴィ
ロック2007.10.11アイ・ウォント・イット・ザット・ウェイバックストリート・ボーイズ
洋楽人気動画2007.09.14マイ・ハート・ウィル・ゴー・オンセリーヌ・ディオン
洋楽人気動画2007.07.12ヒーローマライア・キャリー
洋楽人気動画2007.03.21オールウェイズ・ラヴ・ユーホイットニー・ヒューストン
洋楽人気動画2007.02.19オネスティビリー・ジョエル
洋楽人気動画2005.09.16