TED日本語
TED Talks(英語 日本語字幕付き動画)
TED日本語 - アラン・スミス: 統計を好きになるべき理由
TED Talks
統計を好きになるべき理由
Why you should love statistics
アラン・スミス
Alan Smith
内容
あなたは統計データを推測するのは得意ですか?そう思う人は考え直した方がいいでしょう。数学の得意、不得意に関わらず、私たちが数字を理解し操作する能力は極めて限られている、そう話すのはデータ視覚化の専門家アラン・スミスです。彼は、楽しい話を通して、私たちが知っていることと、そう思っているだけなことのギャップを探ります。


字幕
SCRIPT
Script

Back in 2003, the UK government carried out a survey. And it was a survey that measured levels of numeracy in the population. And they were shocked to find out that for every 100 working age adults in the country,47 of them lacked Level 1 numeracy skills. Now, Level 1 numeracy skills -- that's low-end GCSE score. It's the ability to deal with fractions, percentages and decimals. So this figure prompted a lot of hand-wringing in Whitehall. Policies were changed, investments were made, and then they ran the survey again in 2011. So can you guess what happened to this number? It went up to 49.
(Laughter)
And in fact, when I reported this figure in the FT,one of our readers joked and said, "This figure is only shocking to 51 percent of the population."
(Laughter)
But I preferred, actually, the reaction of a schoolchild when I presented at a school this information, who raised their hand and said, "How do we know that the person who made that number isn't one of the 49 percent either?"
(Laughter)
So clearly, there's a numeracy issue, because these are important skills for life, and a lot of the changes that we want to introduce in this century involve us becoming more comfortable with numbers.
Now, it's not just an English problem. OECD this year released some figures looking at numeracy in young people, and leading the way, the USA -- nearly 40 percent of young people in the US have low numeracy. Now, England is there too, but there are seven OECD countries with figures above 20 percent. That is a problem, because it doesn't have to be that way. If you look at the far end of this graph, you can see the Netherlands and Korea are in single figures. So there's definitely a numeracy problem that we want to address.
Now, as useful as studies like these are, I think we risk herding people inadvertently into one of two categories; that there are two kinds of people: those people that are comfortable with numbers, that can do numbers, and the people who can't. And what I'm trying to talk about here today is to say that I believe that is a false dichotomy. It's not an immutable pairing. I think you don't have to have tremendously high levels of numeracy to be inspired by numbers, and that should be the starting point to the journey ahead.
And one of the ways in which we can begin that journey, for me, is looking at statistics. Now, I am the first to acknowledge that statistics has got somewhat of an image problem.
(Laughter)
It's the part of mathematics that even mathematicians don't particularly like, because whereas the rest of maths is all about precision and certainty, statistics is almost the reverse of that. But actually, I was a late convert to the world of statistics myself. If you'd asked my undergraduate professors what two subjects would I be least likely to excel in after university, they'd have told you statistics and computer programming, and yet here I am, about to show you some statistical graphics that I programmed.
So what inspired that change in me? What made me think that statistics was actually an interesting thing? It's really because statistics are about us. If you look at the etymology of the word statistics, it's the science of dealing with data about the state or the community that we live in. So statistics are about us as a group, not us as individuals. And I think as social animals, we share this fascination about how we as individuals relate to our groups, to our peers. And statistics in this way are at their most powerful when they surprise us.
And there's been some really wonderful surveys carried out recently by Ipsos MORI in the last few years. They did a survey of over 1,000 adults in the UK, and said, for every 100 people in England and Wales, how many of them are Muslim? Now the average answer from this survey, which was supposed to be representative of the total population, was 24. That's what people thought. British people think 24 out of every 100 people in the country are Muslim. Now, official figures reveal that figure to be about five. So there's this big variation between what we think, our perception, and the reality as given by statistics. And I think that's interesting. What could possibly be causing that misperception?
And I was so thrilled with this study, I started to take questions out in presentations. I was referring to it. Now, I did a presentation at St. Paul's School for Girls in Hammersmith, and I had an audience rather like this, except it was comprised entirely of sixth-form girls. And I said, "Girls, how many teenage girls do you think the British public think get pregnant every year?" And the girls were apoplectic when I said the British public think that 15 out of every 100 teenage girls get pregnant in the year. And they had every right to be angry, because in fact, I'd have to have closer to 200 dots before I could color one in, in terms of what the official figures tell us.
And rather like numeracy, this is not just an English problem. Ipsos MORI expanded the survey in recent years to go across the world. And so, they asked Saudi Arabians, for every 100 adults in your country, how many of them are overweight or obese? And the average answer from the Saudis was just over a quarter. That's what they thought. Just over a quarter of adults are overweight or obese. The official figures show, actually, it's nearer to three-quarters.
(Laughter)
So again, a big variation.
And I love this one: they asked in Japan, they asked the Japanese, for every 100 Japanese people, how many of them live in rural areas? The average was about a 50-50 split, just over halfway. They thought 56 out of every 100 Japanese people lived in rural areas. The official figure is seven.
So extraordinary variations, and surprising to some, but not surprising to people who have read the work of Daniel Kahneman, for example, the Nobel-winning economist. He and his colleague, Amos Tversky, spent years researching this disjoint between what people perceive and the reality, the fact that people are actually pretty poor intuitive statisticians. And there are many reasons for this. Individual experiences, certainly, can influence our perceptions, but so, too, can things like the media reporting things by exception, rather than what's normal. Kahneman had a nice way of referring to that. He said, "We can be blind to the obvious" -- so we've got the numbers wrong -- "but we can be blind to our blindness about it." And that has enormous repercussions for decision making.
So at the statistics office while this was all going on, I thought this was really interesting. I said, this is clearly a global problem, but maybe geography is the issue here. These were questions that were all about, how well do you know your country? So in this case, it's how well do you know 64 million people? Not very well, it turns out. I can't do that. So I had an idea, which was to think about this same sort of approach but to think about it in a very local sense. Is this a local? If we reframe the questions and say, how well do you know your local area, would your answers be any more accurate?
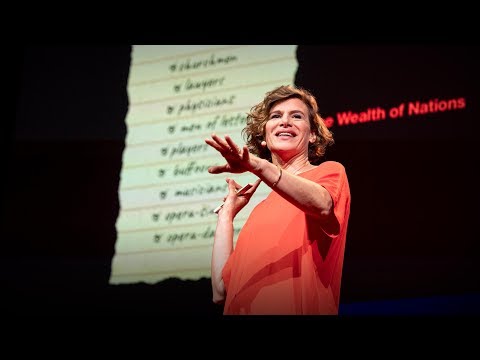
So I devised a quiz: How well do you know your area? It's a simple Web app. You put in a post code and then it will ask you questions based on census data for your local area. And I was very conscious in designing this. I wanted to make it open to the widest possible range of people, not just the 49 percent who can get the numbers. I wanted everyone to engage with it. So for the design of the quiz, I was inspired by the isotypes of Otto Neurath from the 1920s and '30s. Now, these are methods for representing numbers using repeating icons. And the numbers are there, but they sit in the background. So it's a great way of representing quantity without resorting to using terms like "percentage," "fractions" and "ratios."
So here's the quiz. The layout of the quiz is, you have your repeating icons on the left-hand side there, and a map showing you the area we're asking you questions about on the right-hand side. There are seven questions. Each question, there's a possible answer between zero and a hundred, and at the end of the quiz, you get an overall score between zero and a hundred. And so because this is TEDxExeter, I thought we would have a quick look at the quiz for the first few questions of Exeter. And so the first question is: For every 100 people, how many are aged under 16? Now, I don't know Exeter very well at all, so I had a guess at this, but it gives you an idea of how this quiz works. You drag the slider to highlight your icons, and then just click "Submit" to answer, and we animate away the difference between your answer and reality. And it turns out, I was a pretty terrible guess: five.
How about the next question? This is asking about what the average age is, so the age at which half the population are younger and half the population are older. And I thought 35 -- that sounds middle-aged to me.
(Laughter)
Actually, in Exeter, it's incredibly young, and I had underestimated the impact of the university in this area. The questions get harder as you go through. So this one's now asking about homeownership: For every 100 households, how many are owned with a mortgage or loan? And I hedged my bets here, because I didn't want to be more than 50 out on the answer.
(Laughter)
And actually, these get harder, these questions, because when you're in an area, when you're in a community, things like age -- there are clues to whether a population is old or young. Just by looking around the area, you can see it. Something like homeownership is much more difficult to see, so we revert to our own heuristics, our own biases about how many people we think own their own homes.
Now the truth is, when we published this quiz, the census data that it's based on was already a few years old. We've had online applications that allow you to put in a post code and get statistics back for years. So in some senses, this was all a little bit old and not necessarily new. But I was interested to see what reaction we might get by gamifying the data in the way that we have, by using animation and playing on the fact that people have their own preconceptions.
It turns out, the reaction was, um ... was more than I could have hoped for. It was a long-held ambition of mine to bring down a statistics website due to public demand.
(Laughter)
This URL contains the words "statistics," "gov" and "UK," which are three of people's least favorite words in a URL. And the amazing thing about this was that the website came down at quarter to 10 at night, because people were actually engaging with this data of their own free will, using their own personal time. I was very interested to see that we got something like a quarter of a million people playing the quiz within the space of 48 hours of launching it. And it sparked an enormous discussion online, on social media, which was largely dominated by people having fun with their misconceptions, which is something that I couldn't have hoped for any better, in some respects. I also liked the fact that people started sending it to politicians. How well do you know the area you claim to represent?
(Laughter)
And then just to finish, going back to the two kinds of people, I thought it would be really interesting to see how people who are good with numbers would do on this quiz. The national statistician of England and Wales, John Pullinger, you would expect he would be pretty good. He got 44 for his own area.
(Laughter)
Jeremy Paxman -- admittedly, after a glass of wine -- 36. Even worse. It just shows you that the numbers can inspire us all. They can surprise us all.
So very often, we talk about statistics as being the science of uncertainty. My parting thought for today is: actually, statistics is the science of us. And that's why we should be fascinated by numbers.
Thank you very much.
(Applause)
2003年に イギリス政府が ある調査をしました 国民の数学能力のレベルを測るための 調査です 関係者が衝撃を受けたのは 数学能力がレベル1に達しない人が 成人の労働人口100人当たり 47人に上ったことです レベル1は一般中等教育修了資格試験で 一番下のレベルに相当し 分数、割合、小数を使えるレベルです この結果を受けてイギリス政府に 不安が広がりました 政策を見直し 教育予算を増額して 2011年に再び 調査を実施しました 結果は どうなったと思いますか? 100人中49人に増えたんです
(笑)
私がフィナンシャル・タイムズ紙で この結果を報じた時 こんなジョークを言った読者がいました 「この結果にショックを受けるのは 国民の51%だけだ」
(笑)
私がもっと気に入ったのは この話を学校で紹介した時の ある生徒の反応でした その生徒は挙手して言ったんです 「その結果をまとめた人は本当に 49%の方には入ってないんですよね?」
(笑)
数学能力が大事な問題であるのは 明らかです 生活上 大切なスキルですし 私たちが今世紀中の 実現を目指す変革の多くは 私たちが数字に強くなることを 必要とするからです
これはイギリスだけの問題ではありません OECDは2016年に 若者の数学能力に関する 調査結果を公表しました まずは アメリカですが 40%近くの若者は 十分な数学能力が身についていません イギリスも グラフにありますが 割合が20%を超えるOECD諸国が 7つもあります これは問題です 必然的な結果ではないからです このグラフの右端を見ると オランダや韓国は 1桁台なのがわかります だから数学能力の問題には 絶対に取り組む必要があります
さて こういった調査と同様に 役に立つのは つい人を2種類に分けてしまう 私たちの傾向を考えてみることでしょう つまり人間には2タイプいて 数字に強く計算が得意な人と 計算が苦手な人に分けてしまいがちなのです 私が今日お話ししたいのは そんな分け方は 間違っているということです 決して変えられない分類ではありません 数字から新たな発想をするのに そこまで高度な数学的能力は 必要ないでしょうし そういう考え方を元にして 検討を進めていくべきです
検討を進める方法の1つとして 私の場合は 統計を取り上げました 統計は イメージに問題があると 認める人間は 私が初めてですかね?
(笑)
統計学は数学の一部門ですが 数学者さえ それほど好きではありません 統計学を除く数学では 正確さと確実性がすべてですが 統計学は ほぼ正反対だからです ただ本当は 私が統計の世界に入ったのも 比較的最近のことです もし私が学部生だった頃 教授に 卒業後 私が才能を発揮する見込みが 最も低い分野を2つ挙げてもらったら 統計とプログラミングを 挙げたでしょうが これから皆さんに見ていただくのは 私がプログラムした 統計グラフです
私に一体何が起きたのでしょう? 統計が 本当は面白いと 思うようになったのは なぜでしょう? それは統計が 私たち自身に関する学問だからです 「統計」の語源を見ていくと それは私たちが暮らす 国や地域に関わる データを扱う科学のことだと わかります つまり統計とは 個人ではなく 集団としての私たちに関する 学問なのです 私たちは社会的存在として 個人が集団や仲間と どう関わっているかに 皆 関心を持つものです 統計が最も力を発揮するのは 驚くべき発見がある時です
ここ数年 調査会社イプソスモリが とても素晴らしい調査を 実施しています ある調査ではイギリス国内の 1,000人以上の成人を対象に こんな質問をしました 「イングランドとウェールズで イスラム教徒は 100人当たり何人でしょう?」 この調査での平均的な回答 ― つまり全人口を代表する回答は 「24人」でした これが人々のイメージなのです イギリス人は 国内の100人中24人が イスラム教徒だと思っています 一方 公表された数値によれば 実際の数は およそ5人です つまり 私たちのイメージや認識と 統計からわかる現実との間には 大きな隔たりがあるのです そこが面白いところだと思います こういう認識の誤りは 何が原因で起こるのでしょう?
私はこの調査に すっかり興奮して 自分のプレゼンで 調査項目から 質問を出すようになったのです ハマースミスにある セント・ポール女学校で プレゼンをした時は 今と同じような聴衆でしたが 全員 女子高生でした そこで私は言ったんです 「イギリスの一般市民は 十代の女子が毎年何人妊娠すると 考えているでしょう?」 私が答えを言うと 皆 激怒しました イギリスの一般市民は 1年間で 十代女子の100人中15人が 妊娠したと思っていたのです 彼女たちが怒るのも もっともで 公表された数字によると 実際には 妊娠した女の子を 1人見つけるには 200人近く 必要になるのです
数学能力の場合と同じで これはイギリスだけの問題ではありません イプソスモリ社は近年 調査対象を世界に拡大し サウジアラビア人には こんな質問をしました 「サウジアラビアの成人100人につき 太り気味または肥満の人は 何人でしょうか?」 平均は4分の1ちょっとという 回答でした これが彼らのイメージです 太り気味または肥満は 全体の4分の1ちょっと でも公表された数字によると 実際は4分の3近くに上ります
(笑)
ここにも 大きな開きがあります
私のお気に入りはこれ 日本人への質問です 「日本人100人当たり 農村部に住んでいる人は 何人でしょうか?」 平均は だいたい半々 半分を少し超えるくらいでした 日本人は100人中56人が 農村部に住んでいると思っていたのです でも公表された数字では7人です
ズレがあまりにも大きいので 驚く人もいますが 例えばノーベル賞経済学者 ダニエル・カーネマンの 著書を読んだことがあれば それほど驚かないでしょう カーネマンと 同僚のエイモス・トベルスキーは 人の認識と現実は かけ離れていて 統計に対する勘は まったく当てにならないことを 長年研究してきました これには理由がいろいろあります 確かに個人の経験は 認識に影響を与えますが 例えば メディアなどからの影響もあります 普通のことより 例外を大きく報じますから カーネマンは これをうまく説明しています 「明白なものも見えない時がある」 だから数字を見誤るわけです 「ただ 見えていないことにさえ 気づかないことがある」 これは意思決定に 大きな影響を及ぼします
この頃 私は 国家統計局に勤務していて とても面白いと思い こう考えました これは明らかに 地球規模の問題だけれど 重要なのは地理に 詳しいかどうかかもしれない 結局 自分の国をどれだけ 知っているかに尽きるのではないか この場合 イギリス国民6,400万人を どれだけよく知っているのか? 実は それほど知らないのです 知りようがありません そこで思いついたのが イプソスモリの調査と 同じアプローチをとりつつ もっと地域志向の考え方をすることでした 地域が問題なのではないか?と 質問の仕方を変えて 回答者の地元についての知識を尋ねれば 回答はもっと正確になるだろうか?
そこで私はテストを作りました あなたはどのくらい地元を知っているか? これは単純なウェブ・アプリです 郵便番号を入力すると その地域の国勢調査データを 元にした ― テストが出ます デザインには とても気を使いました 私は 数字を理解できる [51%]の人々だけでなく できるだけ いろいろな人を 対象にしたかったし 皆にやって欲しかったのです だからテストのデザインには オットー・ノイラートによる 1920~30年代の図像統計の技法 ― 「アイソタイプ」からヒントを得ました アイコンをこんなふうに並べて 数字を表現するという この技法を使っています 数字は存在していますが 背景に潜んでいるのです この技法だと 数量をうまく表すことができ 「パーセント」とか「何分の1」とか 「比」といった用語を 使う必要がなくなります
さて テストを見てみましょう レイアウトは 画面の左側に アイコンが並んでいて 右側には 質問の対象となる 地域を示した 地図が表示されます 質問は7つです それぞれ 0から100で答え テストが終わると 合計スコアが 0から100の値で表示されます ここはTEDxExeterですから テストの最初の数問は エクスターに関するものにしました 1番目の質問は こうです 「16歳未満の人は 100人当たり何人?」 私はエクセターについて よく知らないので 勘で答えましたが テストの仕組みは わかるでしょう スライダーをドラッグして アイコンに色をつけ 「送信」をクリックするだけで 回答できます すると送った答えと現実との違いが アニメーションで表示されます 結局 推測は全然違いました 5人でした
次の質問はどうでしょう? 平均年齢を聞く質問ですから 要は人口の半分が その年齢より年下になり 半分が年上になる年齢を答えます 私の答えは35歳 ― まさに「中年」でしょう
(笑)
実際は エクセターはかなり若い地域です 私は この地域にある大学の影響を 小さく見積もっていました 質問は進むにつれて難しくなります ここでは家の所有率を聞いています 住宅ローンが残っている家は 100軒当たり何軒でしょう? ここは無難な数にしました 答えが50軒以上違うのは 嫌ですから
(笑)
質問はどんどん難しくなります その地域に住んでいれば 「年齢」のような問題だと 住民が若いか 年をとっているか 判断する手がかりがあります 地域を歩き回れば 状況が見えるのです 「家の所有率」のような問題は はるかに見えにくく 「何人くらい家を持っているか」に関する 経験則やバイアスに いつものように頼ってしまいます
実は 私たちが このテストを公開した時 元になった国勢調査データは 数年前のものでした 当時もうオンライン・アプリに郵便番号を入れると 数年分の統計自体は 見られるようになっていました だから ある意味 これは少し遅れた企画で まったく新規のものとは言えません ただ 面白かったのは こんな風に データをゲーム化し アニメーションを使い 皆 先入観があるという事実で遊ぶことで どんな反応があるか知ることでした
実際のところ 反応は ― 期待以上でした 統計のウェブサイトが 大量のアクセスのせいで落ちることが 以前から私の野望でしたから
(笑)
このURLは “statistics(統計)”、“gov”、“UK”という 誰もが嫌がる3つの言葉が入っています でも すごいのは そのサイトのダウンが 午後9時45分に起きたことです 皆このデータに 自分の意思で しかも個人の時間を割いて アクセスしているということですから とても興味深かったのは 公開から48時間で およそ25万人が このテストに取り組んだことです インターネット上でもSNSでも 大きな話題になりました 話の内容は主に 自分の思い違いを楽しむもので ある意味では いくつかの点で 私が一番望んでいた姿です これを政治家に送る人が出てきたのも いいと思いました 「お膝元のことを どれだけ知っていますか?」と
(笑)
話の最後に 人間には2種類いるという 話に戻りますが 私は 数に強い人々が どの程度の成績なのかを 確認するのが とても楽しみでした イングランドとウェールズの 国家統計官ジョン・プリンジャーなら かなり良い成績だと思うでしょう 44ポイントでした 自分の地元のことなのに
(笑)
ジェレミー・パックスマンさえ 少し飲んでいたとはいえ 36ポイントでした さらに悪いですね 数字は私たち全員を刺激するのです 私たちに驚きを与えます
私たちは統計を不確実性の科学と 呼ぶことも多いです 今日 最後にお伝えしたいのは 統計とは本来 私たち自身に関する 科学だということです だからこそ数字に 関心を持つべきなのです
ありがとうございました
(拍手)
品詞分類
- 主語
- 動詞
- 助動詞
- 準動詞
- 関係詞等
TED 日本語
TED Talks
関連動画

実証実験が示す週4日勤務制の恩恵ジュリエット・ショアー
おすすめ 12022.05.27経済的価値とは何か、そして誰がそれを生み出すのか?マリアナ・マッツカート
2020.01.10教師のこころの健康をどうすればサポートできるかシドニー・ジェンセン
2019.12.13資本主義の不都合な秘密と進むべき道ニック・ハノーアー
2019.10.18新しい言語を学ぶ秘訣 - TED Talkリディア・マホヴァ
2019.01.24人口が100億人に達する地球でどう生き延びるか?チャールズ・C・マン
2018.11.16漫画は教室にふさわしい | TED Talkジーン・ヤン
2018.06.15健全な経済は成長ではなく繁栄を目指しデザインされるべき | TED Talkケイト・ラワース
2018.06.04データで見ると、世界は良くなっているのか、悪くなっているのか?スティーブン・ピンカー
おすすめ 12018.05.21言語はいかに我々の考えを形作るのかレラ・ボロディツキー
2018.05.02公的資金による学術研究の成果を自由に見られないのはなぜか?エリカ・ストーン
2018.04.19子ども達が生涯の読書家になるためにアルヴィン・アービー
2018.04.04人間の感情の歴史ティファニー・ワット・スミス
2018.01.31世帯収入ごとの世界の暮らしを覗いてみようアンナ・ロスリング・ロンランド
おすすめ 12018.01.18職が無くなる未来社会でのお金の稼ぎ方マーティン・フォード
おすすめ 12017.11.16多様な考え方が持つ革命的な力エリフ・シャファク
2017.10.27


洋楽 おすすめ
RECOMMENDS
洋楽歌詞
ステイザ・キッド・ラロイ、ジャスティン・ビーバー
洋楽最新ヒット2021.08.20スピーチレス~心の声ナオミ・スコット
洋楽最新ヒット2019.05.23シェイプ・オブ・ユーエド・シーラン
洋楽人気動画2017.01.30フェイデッドアラン・ウォーカー
洋楽人気動画2015.12.03ウェイティング・フォー・ラヴアヴィーチー
洋楽人気動画2015.06.26シー・ユー・アゲインウィズ・カリファ
洋楽人気動画2015.04.06シュガーマルーン5
洋楽人気動画2015.01.14シェイク・イット・オフテイラー・スウィフト
ポップス2014.08.18オール・アバウト・ザット・ベースメーガン・トレイナー
ポップス2014.06.11ストーリー・オブ・マイ・ライフワン・ダイレクション
洋楽人気動画2013.11.03コール・ミー・メイビーカーリー・レイ・ジェプセン
洋楽人気動画2012.03.01美しき生命コールドプレイ
洋楽人気動画2008.08.04バッド・デイ~ついてない日の応援歌ダニエル・パウター
洋楽人気動画2008.05.14サウザンド・マイルズヴァネッサ・カールトン
洋楽人気動画2008.02.19イッツ・マイ・ライフボン・ジョヴィ
ロック2007.10.11アイ・ウォント・イット・ザット・ウェイバックストリート・ボーイズ
洋楽人気動画2007.09.14マイ・ハート・ウィル・ゴー・オンセリーヌ・ディオン
洋楽人気動画2007.07.12ヒーローマライア・キャリー
洋楽人気動画2007.03.21オールウェイズ・ラヴ・ユーホイットニー・ヒューストン
洋楽人気動画2007.02.19オネスティビリー・ジョエル
洋楽人気動画2005.09.16