TED日本語
TED Talks(英語 日本語字幕付き動画)
TED日本語 - グレッグ・アスナー: 空からの生態学
TED Talks
空からの生態学
Ecology from the air
グレッグ・アスナー
Greg Asner
内容
森林の実態はどうなっているのでしょう。生態学者のグレッグ・アスナー氏は、分光計や高出力レーザーを使い、「高技術炭素量算定法」と呼ぶ方法で、空から大自然の詳細な3D地図を作成します。引き込まれて行くようなトークで、「地球の生態系を守るには、新しい方法で、より多くのデータを集めることが必要だ」と、アスナー氏は語ります。


字幕
SCRIPT
Script
Technology can change our understanding of nature.
Take for example the case of lions. For centuries, it's been said that female lions do all of the hunting out in the open savanna, and male lions do nothing until it's time for dinner. You've heard this too, I can tell. Well recently, I led an airborne mapping campaign in the Kruger National Park in South Africa. Our colleagues put GPS tracking collars on male and female lions, and we mapped their hunting behavior from the air. The lower left shows a lion sizing up a herd of impala for a kill, and the right shows what I call the lion viewshed. That's how far the lion can see in all directions until his or her view is obstructed by vegetation. And what we found is that male lions are not the lazy hunters we thought them to be. They just use a different strategy. Whereas the female lions hunt out in the open savanna over long distances, usually during the day, male lions use an ambush strategy in dense vegetation, and often at night. This video shows the actual hunting viewsheds of male lions on the left and females on the right. Red and darker colors show more dense vegetation, and the white are wide open spaces. And this is the viewshed right literally at the eye level of hunting male and female lions. All of a sudden, you get a very clear understanding of the very spooky conditions under which male lions do their hunting.
I bring up this example to begin, because it emphasizes how littlewe know about nature. There's been a huge amount of work done so far to try to slow down our losses of tropical forests, and we are losing our forests at a rapid rate, as shown in red on the slide. I find it ironic that we're doing so much, yet these areas are fairly unknown to science. So how can we save what we don't understand?
Now I'm a global ecologist and an Earth explorer with a background in physics and chemistry and biology and a lot of other boring subjects, but above all, I'm obsessed with what we don't know about our planet. So I created this, the Carnegie Airborne Observatory, or CAO. It may look like a plane with a fancy paint job, but I packed it with over 1,000 kilos of high-tech sensors, computers, and a very motivated staff of Earth scientists and pilots. Two of our instruments are very unique: one is called an imaging spectrometer that can actually measure the chemical composition of plants as we fly over them. Another one is a set of lasers, very high-powered lasers, that fire out of the bottom of the plane, sweeping across the ecosystem and measuring it at nearly 500,000 times per second in high-resolution 3D. Here's an image of the Golden Gate Bridge in San Francisco, not far from where I live. Although we flew straight over this bridge, we imaged it in 3D, captured its color in just a few seconds. But the real power of the CAO is its ability to capture the actual building blocks of ecosystems. This is a small town in the Amazon, imaged with the CAO. We can slice through our data and see, for example, the 3D structure of the vegetation and the buildings, or we can use the chemical information to actually figure out how fast the plants are growing as we fly over them. The hottest pinks are the fastest-growing plants. And we can see biodiversity in ways that you never could have imagined. This is what a rainforest might look like as you fly over it in a hot air balloon. This is how we see a rainforest, in kaleidoscopic color that tells us that there are many species living with one another. But you have to remember that these trees are literally bigger than whales, and what that means is thatthey're impossible to understand just by walking on the ground below them. So our imagery is 3D, it's chemical, it's biological, and this tells us not only the species that are living in the canopy, but it tells us a lot of information about the rest of the speciesthat occupy the rainforest.
Now I created the CAO in order to answer questions that have proven extremely challenging to answerfrom any other vantage point, such as from the ground, or from satellite sensors. I want to share three of thosequestions with you today. The first questions is, how do we manage our carbon reserves in tropical forests? Tropical forests contain a hugeamount of carbon in the trees, and we need to keep that carbon in those forests if we're going to avoid any further global warming. Unfortunately, global carbon emissions from deforestation now equals the global transportation sector. That's all ships, airplanes, trainsand automobiles combined. So it's understandable that policy negotiators have been working hard to reduce deforestation, but they're doing it on landscapes that are hardly known to science. If you don't know where the carbon is exactly, in detail, how can you know what you're losing? Basically, we need a high-tech accounting system. With our system, we're able to see the carbon stocks of tropical forests in utter detail. The red shows, obviously, closed-canopy tropical forest, and then you see the cookie cutting, or the cutting of the forest in yellows and greens. It's like cutting a cake except this cake is about whale deep. And yet, we can zoom in and see the forest and the trees at the same time. And what's amazing is, even though we flew very high above this forest, later on in analysis, we can go in and actually experience the treetrops, leaf by leaf, branch by branch, just as the other species that live in this forest experience it along with the trees themselves.
We've been using the technology to explore and to actually put out the first carbon geographies in high resolution in faraway places like the Amazon Basin and not-so-faraway places like the United States and Central America. What I'm going to do is I'm going to take youon a high-resolution, first-time tour of the carbon landscapes of Peru and then Panama. The colors are going to be going from red to blue. Red is extremely high carbon stocks, your largest cathedral forests you can imagine, and blue are very low carbon stocks. And let me tell you, Peru alone is an amazing place, totally unknown in terms of its carbon geography until today. We can fly to this area in northern Peru and see super high carbon stocks in red, and the Amazon River and floodplain cutting right through it. We can go to an area of utter devastation caused by deforestation in blue, and the virus of deforestationspreading out in orange. We can also fly to the southern Andes to see the tree line and see exactly how the carbon geography ends as we go up into the mountain system. And we can go to the biggest swampin the western Amazon. It's a watery dreamworld akin to Jim Cameron's "Avatar." We can go to one of the smallest tropical countries, Panama, and see also a huge range of carbon variation, from high in red to low in blue. Unfortunately, most of the carbonis lost in the lowlands, but what you see that's left, in terms of high carbon stocks in greens and reds, is the stuff that's up in the mountains. One interesting exception to this is right in the middle of your screen. You're seeing the buffer zonearound the Panama Canal. That's in the reds and yellows. The canal authorities are using force to protect their watershed and global commerce. This kind of carbon mapping has transformed conservation and resource policy development. It's really advancing our ability to save forests and to curb climate change.
My second question: How do weprepare for climate change in a place like the Amazon rainforest? Let me tell you, I spend a lot of time in these places, and we're seeingthe climate changing already. Temperatures are increasing, and what's really happening iswe're getting a lot of droughts, recurring droughts. The 2010 mega-drought is shown here with red showing an areaabout the size of Western Europe. The Amazon was so dry in 2010 that even the main stem of the Amazon river itself dried up partially, as you see in the photo in the lower portion of the slide. What we found is that in very remote areas, these droughts are having a big negative impact on tropical forests. For example, these are all of the dead trees in red that suffered mortality following the 2010 drought. This area happens to be on the border of Peru and Brazil, totally unexplored, almost totally unknown scientifically.
So what we think, as Earth scientists, is species are going to have to migrate with climate change from the east in Brazil all the way west into the Andes and up into the mountains in order to minimize theirexposure to climate change. One of the problems with this is that humans are taking apart the western Amazon as we speak. Look at this 100-square-kilometer gash in the forest created by gold miners. You see the forest in green in 3D, and you see the effects of gold mining down below the soil surface. Species have nowhere to migratein a system like this, obviously.
If you haven't been to the Amazon, you should go. It's an amazing experience every time, no matter where you go. You're going to probably see it this way, on a river. But what happens is a lot of times the rivers hide what's really going on back in the forest itself. We flew over this same river, imaged the system in 3D. The forest is on the left. And then we can digitally remove the forest and see what's going on below the canopy. And in this case, we found gold mining activity, all of it illegal, set back away from the river's edge, as you'll see in those strange pockmarks coming up on your screen on the right. Don't worry, we're working with the authorities to deal with this and many, many other problems in the region.
So in order to put together a conservation plan for these unique, important corridors like the western Amazonand the Andes Amazon corridor, we have to start making geographically explicit plans now. How do we do that if we don't knowthe geography of biodiversity in the region, if it's so unknown to science? So what we've been doing is using the laser-guided spectroscopy from the CAO to map for the first time the biodiversity of the Amazon rainforest. Here you see actual data showingdifferent species in different colors. Reds are one type of species, blues are another, and greens are yet another. And when we take this together and scale up to the regional level, we get a completely new geography of biodiversity unknown prior to this work. This tells us where the big biodiversity changes occur from habitat to habitat, and that's really important because it tells us a lot about where species may migrate to and migrate from as the climate shifts. And this is the pivotal information that's needed by decision makers to develop protected areas in the context of their regional development plans.
And third and final question is, how do we manage biodiversity on a planet of protected ecosystems? The example I started outwith about lions hunting, that was a study we did behind the fence line of a protected area in South Africa. And the truth is, much of Africa's nature is going to persist into the future in protected areas like I show in blue on the screen. This puts incredible pressure and responsibility on park management. They need to do and make decisions that will benefit all of the speciesthat they're protecting. Some of their decisions have really big impacts. For example, how much and where to use fire as a management tool? Or, how to deal with a large species like elephants, which may, if their populations get too large, have a negative impact on the ecosystem and on other species. And let me tell you, these types of dynamics really play out on the landscape. In the foreground is an area with lots of fire and lots of elephants: wide open savanna in blue, and just a few trees. As we cross this fence line, now we're getting into an area that has had protection from fire and zero elephants: dense vegetation, a radically different ecosystem. And in a place like Kruger, the soaring elephant densities are a real problem. I know it's a sensitive issue for many of you, and there are no easy answers with this. But what's good is thatthe technology we've developed and we're working with in South Africa, for example, is allowing us to map everysingle tree in the savanna, and then through repeat flights we're able to see which trees are being pushed over by elephants, in the red as you see on the screen, and how much that's happening in different types of landscapes in the savanna. That's giving park managers a very first opportunity to use tactical management strategiesthat are more nuanced and don't lead to those extremesthat I just showed you. So really, the way we're looking at protected areas nowadays is to think of it as tending to a circle of life, where we have fire management, elephant management, those impacts onthe structure of the ecosystem, and then those impacts affecting everything from insects up to apex predators like lions.
Going forward, I plan to greatly expand the airborne observatory. I'm hoping to actually put the technology into orbit so we can manage the entire planet with technologies like this. Until then, you're going to find me flying in some remote place that you've never heard of. I just want to end by saying that technology is absolutely critical to managing our planet, but even more important is the understanding and wisdom to apply it.
Thank you.
(Applause)
テクノロジーは私たちの自然に対する考えを変える力を持っています
例えばライオンについては 何世紀もの間サバンナでの狩りは 全て雌が行い 雄は食べるだけだと言われて来ました 皆さんも聞いたことがある話だと思います 最近 南アフリカのクルーガー国立公園で 航空地図を作製したのですが 同僚がGPSで追跡できる首輪を ライオンに付けて 空から狩りの行動を 追跡しました 左下ではライオンがインパラの群れに 忍び寄っているのが見えます その右側はライオンの - 可視域と私が呼ぶものです 草木に邪魔されずに ライオンの視野が届く範囲を示しています この調査から 雄は私たちが思っていた様な怠け者ではないということが分かりました ただ狩りの仕方が違っていただけです 雌は見通しの良いサバンナで 普段 昼間に 広範囲に渡る狩りをし 雄は よく夜に 深い茂みの中で獲物を待ち伏せます このビデオは実際に狩りをしている時の可視域で - 雄が左側 雌が右側にいます 赤と濃い色は草木の茂っている場所で 白は広くオープンな場所です これは狩りをしている雄と雌の 丁度目の高さの可視域です 雄ライオンが狩りをしている時の 不気味な緊張感が突如 - ひしひしと伝わって来ますね
最初にこんな話をしたのは 私たちが いかに自然について無知なのかを伝えたかったからです これまでに 熱帯雨林の消失を食い止めるための さまざまな試みが行われてきましたが この図の赤い部分が示すように 熱帯雨林は急速に減少しています あらゆる手段が尽くされているのにこの様な場所は 科学的にほとんど分かっていないというのは皮肉なことです 理解できなければどうやって保護できるのでしょう
私は地球生態学者で探検家です 物理 化学 生物学や その他諸々 退屈な科目を学んできましたが その中でも地球に関する未知の部分に取り付かれています そこでー 「カーネギー空中観測所(CAO)」を設立しました 可愛く塗装を施した飛行機という感じですが 高度なセンサーやコンピュータなど 1トン以上の装備を積み 意欲満々の地球科学者と パイロットが乗っています とてもユニークな機材が2つあり 1つは画像分光計で 植物の化学組成を 上空から計測できます もう1つは とても高出力を持つ レーザーです 機体の底部から放射され 生態系を走査し 1秒間にほぼ50万回 高解像度3Dで測定します 私の家の近くにあるサンフランシスコの ゴールデンゲート橋の画像です この橋の真上を飛び 3Dのカラーイメージを ほんの数秒で作成できます しかしCAOの本領は 生態系の実際の構成要素を測定する能力です これはCAOで撮った アマゾンの小さな町です データを薄切りするように 例えば3Dで植生と建物を見たり 化学情報を使い 植物の成長速度を実測することが 上空を飛行しながら可能です 濃いピンク色は植物の成長が最も速い所です 生物の多様性を 今まで想像もできなかった方法で見られます これは熱気球で 飛んだ時の熱帯雨林の様子です これを見ると熱帯雨林には 万華鏡のような様々な色で 多様な種が共存していることが分かります ここで知っておいてほしいのは こうした樹木はクジラより大きいので 地上を歩いているだけでは 理解はできないということです 私たちの画像は3Dで化学的 生物学的な分析ができるので 林冠に生息する種だけでなく 熱帯雨林を埋め尽くす - 他の生物に関してもいろいろな情報が得られます
地上や人工衛星のセンサーなど 他の視点からでは決して分からないことを 解明する為に CAOを立ち上げたのです 今日は3つの質問を取り上げたいと思います 最初の質問は 熱帯林で - 炭素蓄積状況をどうやって管理するかということです 熱帯林の樹木は大量の炭素を蓄積しています その炭素は森にとどめておく必要があります さらなる地球温暖化をくいとめる為です しかし残念ながら森林伐採から生じる 世界の炭素排出量は 船 飛行機 電車 車など全てを含めた 世界の交通機関が出す排出量と同じほどもあります 森林伐採を抑制するための政策作りに 政治家は励んでいますが そうした場所は 科学では未知の世界なのです 炭素の蓄積場所を知らなければ 何を失っているのかを知ることもできません そのためには 高度な積算システムが必要です 私たちの持つシステムで極めて詳細な 熱帯林の炭素蓄積量を知ることができます 赤は閉鎖林冠の熱帯林を示し 黄色や緑色はクッキーの形を取られたように 森が伐採されている箇所です まるでケーキのを切っているかのようですが 厚さがクジラほどもあります ズームインして森を見ることも 木々を見ることもできます 素晴らしいことに 森のずっと上空を飛んでいるのに 後で分析する時には 木々のてっぺんを間近に感じ 枝や葉の1つ1つまで見ることができます 森にすむ生物や木々そのものになったかのような 感じになるのです
このテクノロジーを使って 初の高解像度な炭素地形図を作成するため アマゾン川流域のような遠い所や それ程 遠くもないアメリカや中米などに赴きました ペルーとパナマの初めての炭素地形図をお見せします 赤から青い色になっていきます 赤は炭素の蓄積量が非常に多く 樹木が最も高く茂っている所です 青は炭素蓄積量が非常に少ない所です ペルーだけでも驚くような結果が出ました 炭素の分布状態は 今日まで全く知られていなかったのです ペルー北部では 赤色の特に炭素の蓄積量が多い所を アマゾン川と氾濫原が 通り抜けています 完全に伐採され破壊された森は青で 伐採というウィルスが広がっている所はオレンジ色です 南アンデスに飛ぶと樹木限界線が見え 山の中に入るにつれ 炭素地形が 終わっているのがはっきり見えます アマゾンの西に行くと最大級の沼地が見えます 夢のような湿地帯です ジェームズ・キャメロンの『アバター』を思わせます 最小の熱帯国の1つパナマに行くと 炭素蓄積量が多い赤色から少ない青色まで ばらつきが非常に大きいことがわかります 残念ながら低地では 炭素のほとんどが失われています 残ったものはというと 赤や緑色で示される高い炭素の蓄積量は 山の中で見られます 1つ面白い例外が画面の真ん中にあります パナマ運河周辺に緩衝地帯が見えます 赤と黄色になっていますね 運河の運営機関は 世界貿易と合わせて運河流域の保護にも力を注いでいるのです この様な調査により 資源と森林保全に対する政策が変わりました 炭素地形図は 森林保護と温暖化防止の取り組みを 進化させているのです
次の質問はアマゾン熱帯雨林のような場所の 気候変化にどう対処すべきかということです 私はこんな場所で 過ごすことが多いので既に気候変化を目の当たりにしています 気温が上がり 干ばつが増え しかも繰り返し起きています 2010年の大干ばつは この図に赤で示してありますが西ヨーロッパの面積にほぼ匹敵します アマゾン地域は2010年には 乾燥がひどくアマゾン川の主流さえ 一部干上がりました 右下の写真がその時の様子です 遠く離れた辺境の地では このような干ばつで熱帯林は 大被害を受けています 例えば2010年の干ばつ後 枯れてしまった木を赤で示していますが この場所はペルーとブラジルの国境で 全く探索されておらず 科学的にもほぼ完全に未知の世界です
地球科学者として思うに 生き物は 気象変化が起きると その影響を出来るだけ避けようと 東にあるブラジルからずっと西のアンデスや 山の中へと 移り住まなくてはならなくなるでしょう ここで問題になるのはアマゾン西部を こうしている間にも人間が破壊していることです この100平方キロに及ぶ 採金者たちが作った森の中の傷跡を見て下さい 3D画像の緑色部分が森です 金採掘の影響は 地表の下に見ることができます これでは どんな生き物も何処にも移動出来ないことが 一目でわかります
アマゾンにまだ行ったことがない人は訪れてみるべきです アマゾンは何処に行っても 行く度に驚かされます たぶんこんな景色が見られるでしょう でも 川だけを見ていると 森で実際に何が起きているのか 分からないということがよくあります この同じ川の上を飛び 3Dの画像を撮りました 森は左側です 森をデジタル処理で削除し 林冠の下の様子を見ることができます ここでは川岸から離れた所に 非合法な金採掘場を見つけました 画面の右側に 不自然な窪みが見えますね 心配しないで 私たちは公的機関と共に この問題に対処していますし この地域が抱える他の多くの問題にも取り組んでいます
この地にあるユニークで 重要な回廊 - 西アマゾンや アンデス山脈・アマゾン川回廊地帯の保全計画をまとめるため 具体的な明確な地理計画を 作り始める必要があります でも その地域の生物多様性が科学で全く解明されていないのであれば 計画を作ることはできません それでレーザー作動の CAOの分光計を使い アマゾン熱帯雨林の生物多様性を 初めて地図にしています 実際のデータを使い違う種を違う色で示しました 赤や青 緑が それぞれの種を示しています 規模を拡げて地域全体の 地図を作れば これまでにない 全く新しい 生物多様性の地図が出来上がります そうすれば 生物多様性の大きな変化が 起きている場所がわかるようになります 気候変化により生き物が 何処から何処へ移動するのかがよくわかるので これは非常に大切なことです 政策の立案者にとっても 地域の発展計画と照らし合わせ 保護区を作るためにきわめて肝要な情報です
そして三つ目 最後の質問は 地球上の 保護された生態系の 生物多様性をどう維持して行くかです 最初にお話ししたライオンの狩猟行動の例は 南アフリカの 保護区内での調査でした 実際にはアフリカの自然の多くは この図の青色で示されるような 保護地域内で維持されていくでしょう その為 保護区管理側に非常なプレッシャーと責任が かかってくる事になります 保護している動植物の全ての種を 公平に守る方針を作らなければなりません 方針によっては大きな影響が出ます 例えば火を管理道具として使う 場所とその量についてとか または 象などの大型動物をどう扱うかといったことなどです もし象が過剰に増えた場合 他の生き物や生態系に対して 悪影響を引き起こしかねません こうした相互関係は全生態系に 実に大きく関わってきます 前方は火がたくさん使われていて象の数も多い場所です 青い部分は見通しの良いサバンナで木はほんの少ししかありません この囲い線を越えると 火を使う必要もなければ 象もいない地域になります 植物が生い茂り著しい生態系の違いが見られます クルーガーのような場所では 象の数が急速に増え 大きな問題になっています デリケートな問題です 簡単に解決出来ることではありません でも 私たちが開発し 南アフリカで使ってきたテクノロジーにより 例えばサバンナの全ての木の地図が作れるので 何度も飛行すれば どの木が象に倒されたのかを 知ることができます 画面の赤色が倒された木ですサバンナの何処でどれ程 こうしたことが起きているかがわかるのです これによって 初めて 保護地域の責任者達は 先ほどお見せしたような極端な方針を取ることなく 繊細で周到な管理策を立てられるようになるのです 私たちは最近 保護区のことを 自然な生命のバランスを保つ場所だと考えています 火や象の管理に加え それらが生態系や 昆虫からライオンに至るまで あらゆる生物に与える影響も 管理するということです
ゆくゆくは 空中観測所を 大きく広げていくつもりです 空中観測所を地球周回軌道に打ち上げ 地球全体を調査したいと思っています それまでは誰も知らないような 辺境の地を私は飛び回っているでしょう 最後にひとつお伝えします テクノロジーは地球を管理するのに不可欠なものですが もっと大切なのはその使い方を理解し それを応用する知恵を持つことです
有り難うございました
(拍手)
品詞分類
- 主語
- 動詞
- 助動詞
- 準動詞
- 関係詞等
TED 日本語
TED Talks
関連動画

グリーンランドの氷床の下に何が隠されているのか?クリスティン・ポイナー
おすすめ 12017.11.06アマゾンで伝説の煮えたぎる川を見つけた話アンドレス・ルーソ
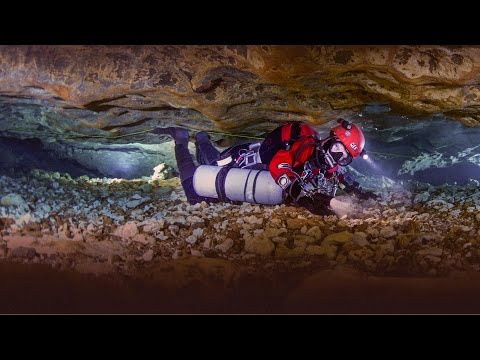
2016.02.23水中洞窟の神秘の世界ジル・ハイネス
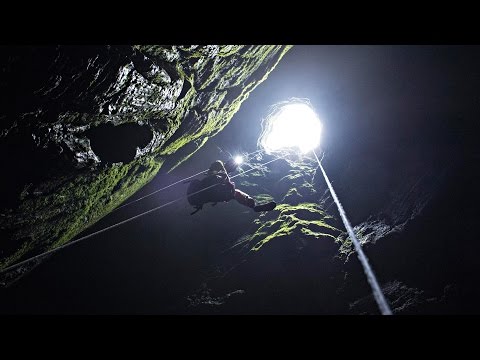
2016.02.08地下深く、美と科学を探してフランチェスコ・サウロ
2015.11.16危機にあるエバーグレーズの息を飲む写真マック・ストーン
2015.10.22動物の王国に声を与える写真フランス・ランティング
2014.10.29動物と人間との関係を浮き彫りにする、テディベアの奇妙なお話ジョン・モアレム
2014.05.27自然の世界に秘められた奇跡ルイ・シュワルツバーグ
おすすめ 32014.04.09氷河洞窟の発見エディ・カルタヤ
2013.12.11ネルソン・マンデラが教えてくれたことボイド・ヴァーティ
2013.12.09自然界からの声バーニー・クラウス
2013.07.15嵐を追いかけてカミール・シーマン
2013.06.21保護すべき身近な原生地の素晴らしい写真ウェイド・デイヴィス
2013.02.26幸福のありか ― 自然と美と感謝とルイ・シュワルツバーグ
おすすめ 42012.11.22まだ見ぬ手つかずの自然の姿カレン・バス
2012.05.09心に焼きつく氷山の写真カミール・シーマン
2011.06.16

洋楽 おすすめ
RECOMMENDS
洋楽歌詞
ステイザ・キッド・ラロイ、ジャスティン・ビーバー
洋楽最新ヒット2021.08.20スピーチレス~心の声ナオミ・スコット
洋楽最新ヒット2019.05.23シェイプ・オブ・ユーエド・シーラン
洋楽人気動画2017.01.30フェイデッドアラン・ウォーカー
洋楽人気動画2015.12.03ウェイティング・フォー・ラヴアヴィーチー
洋楽人気動画2015.06.26シー・ユー・アゲインウィズ・カリファ
洋楽人気動画2015.04.06シュガーマルーン5
洋楽人気動画2015.01.14シェイク・イット・オフテイラー・スウィフト
ポップス2014.08.18オール・アバウト・ザット・ベースメーガン・トレイナー
ポップス2014.06.11ストーリー・オブ・マイ・ライフワン・ダイレクション
洋楽人気動画2013.11.03コール・ミー・メイビーカーリー・レイ・ジェプセン
洋楽人気動画2012.03.01美しき生命コールドプレイ
洋楽人気動画2008.08.04バッド・デイ~ついてない日の応援歌ダニエル・パウター
洋楽人気動画2008.05.14サウザンド・マイルズヴァネッサ・カールトン
洋楽人気動画2008.02.19イッツ・マイ・ライフボン・ジョヴィ
ロック2007.10.11アイ・ウォント・イット・ザット・ウェイバックストリート・ボーイズ
洋楽人気動画2007.09.14マイ・ハート・ウィル・ゴー・オンセリーヌ・ディオン
洋楽人気動画2007.07.12ヒーローマライア・キャリー
洋楽人気動画2007.03.21オールウェイズ・ラヴ・ユーホイットニー・ヒューストン
洋楽人気動画2007.02.19オネスティビリー・ジョエル
洋楽人気動画2005.09.16