TED日本語
TED Talks(英語 日本語字幕付き動画)
TED日本語 - アラン・ジョーンズ: 脳の地図
TED Talks
脳の地図
A map of the brain
アラン・ジョーンズ
Allan Jones
内容
脳の機能を理解するには、どこから始めることが出来るでしょうか?街を理解し始める時のように、地図を作りましょう。この魅力的な映像あふれる講演をとおして、アラン・ジョーンズは、いかにして脳の各部分で活性化している遺伝子を特定した地図や、脳の異なる部位がどのように連結されているかという地図を、彼のチームがどうやって作っているのか紹介します。
- 外部リンク
- TED|アラン・ジョーンズ: 脳の地図


字幕
SCRIPT
Script
Humans have long held a fascination for the human brain. We chart it, we've described it, we've drawn it, we've mapped it. Now just like the physical maps of our world that have been highly influenced by technology -- think Google Maps, think GPS -- the same thing is happening for brain mapping through transformation.
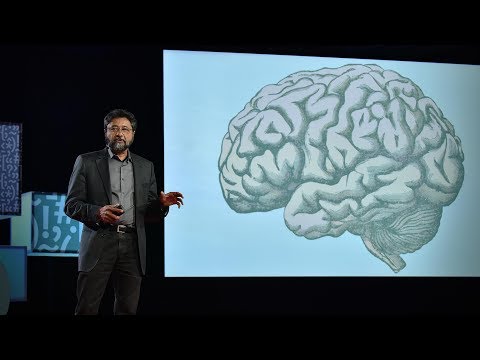
So let's take a look at the brain. Most people, when they first look at a fresh human brain, they say, "It doesn't look what you're typically looking at when someone shows you a brain." Typically, what you're looking at is a fixed brain. It's gray. And this outer layer, this is the vasculature, which is incredible, around a human brain. This is the blood vessels. 20 percent of the oxygen coming from your lungs,20 percent of the blood pumped from your heart, is servicing this one organ. That's basically, if you hold two fists together, it's just slightly larger than the two fists.
Scientists, sort of at the end of the 20th century, learned that they could track blood flow to map non-invasively where activity was going on in the human brain. So for example, they can see in the back part of the brain, which is just turning around there. There's the cerebellum; that's keeping you upright right now. It's keeping me standing. It's involved in coordinated movement. On the side here, this is temporal cortex. This is the area where primary auditory processing -- so you're hearing my words, you're sending it up into higher language processing centers. Towards the front of the brain is the place in which all of the more complex thought, decision making -- it's the last to mature in late adulthood. This is where all your decision-making processes are going on. It's the place where you're deciding right now you probably aren't going to order the steak for dinner.
So if you take a deeper look at the brain,one of the things, if you look at it in cross-section, what you can see is that you can't really see a whole lot of structure there. But there's actually a lot of structure there. It's cells and it's wires all wired together. So about a hundred years ago, some scientists invented a stain that would stain cells. And that's shown here in the the very light blue. You can see areas where neuronal cell bodies are being stained. And what you can see is it's very non-uniform. You see a lot more structure there. So the outer part of that brain is the neocortex. It's one continuous processing unit, if you will. But you can also see things underneath there as well. And all of these blank areas are the areas in which the wires are running through. They're probably less cell dense. So there's about 86 billion neurons in our brain. And as you can see, they're very non-uniformly distributed. And how they're distributed really contributes to their underlying function. And of course, as I mentioned before, since we can now start to map brain function, we can start to tie these into the individual cells.
So let's take a deeper look. Let's look at neurons. So as I mentioned, there are 86 billion neurons. There are also these smaller cells as you'll see. These are support cells -- astrocytes glia. And the nerves themselves are the ones who are receiving input. They're storing it, they're processing it. Each neuron is connected via synapses to up to 10,000 other neurons in your brain. And each neuron itself is largely unique. The unique character of both individual neurons and neurons within a collection of the brain are driven by fundamental properties of their underlying biochemistry. These are proteins. They're proteins that are controlling things like ion channel movement. They're controlling who nervous system cells partner up with. And they're controlling basically everything that the nervous system has to do.
So if we zoom in to an even deeper level, all of those proteins are encoded by our genomes. We each have 23 pairs of chromosomes. We get one from mom,one from dad. And on these chromosomes are roughly 25,000 genes. They're encoded in the DNA. And the nature of a given cell driving its underlying biochemistry is dictated by which of these 25,000 genes are turned on and at what level they're turned on.
And so our project is seeking to look at this readout, understanding which of these 25,000 genes is turned on. So in order to undertake such a project, we obviously need brains. So we sent our lab technician out. We were seeking normal human brains. What we actually start with is a medical examiner's office. This a place where the dead are brought in. We are seeking normal human brains. There's a lot of criteria by which we're selecting these brains. We want to make sure that we have normal humans between the ages of 20 to 60, they died a somewhat natural death with no injury to the brain, no history of psychiatric disease, no drugs on board -- we do a toxicology workup. And we're very careful about the brains that we do take. We're also selecting for brains in which we can get the tissue, we can get consent to take the tissue within 24 hours of time of death. Because what we're trying to measure, the RNA -- which is the readout from our genes -- is very labile, and so we have to move very quickly.
One side note on the collection of brains: because of the way that we collect, and because we require consent, we actually have a lot more male brains than female brains. Males are much more likely to die an accidental death in the prime of their life. And men are much more likely to have their significant other, spouse, give consent than the other way around.
(Laughter)
So the first thing that we do at the site of collection is we collect what's called an MR. This is magnetic resonance imaging -- MRI. It's a standard template by which we're going to hang the rest of this data. So we collect this MR. And you can think of this as our satellite view for our map. The next thing we do is we collect what's called a diffusion tensor imaging. This maps the large cabling in the brain. And again, you can think of this as almost mapping our interstate highways, if you will. The brain is removed from the skull, and then it's sliced into one-centimeter slices. And those are frozen solid, and they're shipped to Seattle. And in Seattle, we take these -- this is a whole human hemisphere -- and we put them into what's basically a glorified meat slicer. There's a blade here that's going to cut across a section of the tissue and transfer it to a microscope slide. We're going to then apply one of those stains to it, and we scan it. And then what we get is our first mapping.
So this is where experts come in and they make basic anatomic assignments. You could consider this state boundaries, if you will, those pretty broad outlines. From this, we're able to then fragment that brain into further pieces, which then we can put on a smaller cryostat. And this is just showing this here -- this frozen tissue, and it's being cut. This is 20 microns thin, so this is about a baby hair's width. And remember, it's frozen. And so you can see here, old-fashioned technology of the paintbrush being applied. We take a microscope slide. Then we very carefully melt onto the slide. This will then go onto a robot that's going to apply one of those stains to it. And our anatomists are going to go in and take a deeper look at this.
So again this is what they can see under the microscope. You can see collections and configurations of large and small cells in clusters and various places. And from there it's routine. They understand where to make these assignments. And they can make basically what's a reference atlas. This is a more detailed map.
Our scientists then use this to go back to another piece of that tissue and do what's called laser scanning microdissection. So the technician takes the instructions. They scribe along a place there. And then the laser actually cuts. You can see that blue dot there cutting. And that tissue falls off. You can see on the microscope slide here, that's what's happening in real time. There's a container underneath that's collecting that tissue. We take that tissue, we purify the RNA out of it using some basic technology, and then we put a florescent tag on it. We take that tagged material and we put it on to something called a microarray.
Now this may look like a bunch of dots to you, but each one of these individual dots is actually a unique piece of the human genome that we spotted down on glass. This has roughly 60,000 elements on it, so we repeatedly measure various genes of the 25,000 genes in the genome. And when we take a sample and we hybridize it to it, we get a unique fingerprint, if you will, quantitatively of what genes are turned on in that sample.
Now we do this over and over again, this process for any given brain. We're taking over a thousand samples for each brain. This area shown here is an area called the hippocampus. It's involved in learning and memory. And it contributes to about 70 samples of those thousand samples. So each sample gets us about 50,000 data points with repeat measurements, a thousand samples.
So roughly, we have 50 million data points for a given human brain. We've done right now two human brains-worth of data. We've put all of that together into one thing, and I'll show you what that synthesis looks like. It's basically a large data set of information that's all freely available to any scientist around the world. They don't even have to log in to come use this tool, mine this data, find interesting things out with this. So here's the modalities that we put together. You'll start to recognize these things from what we've collected before. Here's the MR. It provides the framework. There's an operator side on the right that allows you to turn, it allows you to zoom in, it allows you to highlight individual structures.
But most importantly, we're now mapping into this anatomic framework, which is a common framework for people to understand where genes are turned on. So the red levels are where a gene is turned on to a great degree. Green is the sort of cool areas where it's not turned on. And each gene gives us a fingerprint. And remember that we've assayed all the 25,000 genes in the genome and have all of that data available.
So what can scientists learn about this data? We're just starting to look at this data ourselves. There's some basic things that you would want to understand. Two great examples are drugs, Prozac and Wellbutrin. These are commonly prescribed antidepressants. Now remember, we're assaying genes. Genes send the instructions to make proteins. Proteins are targets for drugs. So drugs bind to proteins and either turn them off, etc. So if you want to understand the action of drugs, you want to understand how they're acting in the ways you want them to, and also in the ways you don't want them to. In the side effect profile, etc., you want to see where those genes are turned on. And for the first time, we can actually do that. We can do that in multiple individuals that we've assayed too.
So now we can look throughout the brain. We can see this unique fingerprint. And we get confirmation. We get confirmation that, indeed, the gene is turned on -- for something like Prozac, in serotonergic structures, things that are already known be affected -- but we also get to see the whole thing. We also get to see areas that no one has ever looked at before, and we see these genes turned on there. It's as interesting a side effect as it could be. One other thing you can do with such a thing is you can, because it's a pattern matching exercise, because there's unique fingerprint, we can actually scan through the entire genome and find other proteins that show a similar fingerprint. So if you're in drug discovery, for example, you can go through an entire listing of what the genome has on offer to find perhaps better drug targets and optimize.
Most of you are probably familiar with genome-wide association studies in the form of people covering in the news saying, "Scientists have recently discovered the gene or genes which affect X." And so these kinds of studies are routinely published by scientists and they're great. They analyze large populations. They look at their entire genomes, and they try to find hot spots of activity that are linked causally to genes. But what you get out of such an exercise is simply a list of genes. It tells you the what, but it doesn't tell you the where. And so it's very important for those researchers that we've created this resource. Now they can come in and they can start to get clues about activity. They can start to look at common pathways -- other things that they simply haven't been able to do before.
So I think this audience in particular can understand the importance of individuality. And I think every human, we all have different genetic backgrounds, we all have lived separate lives. But the fact is our genomes are greater than 99 percent similar. We're similar at the genetic level. And what we're finding is actually, even at the brain biochemical level, we are quite similar. And so this shows it's not 99 percent, but it's roughly 90 percent correspondence at a reasonable cutoff, so everything in the cloud is roughly correlated. And then we find some outliers, some things that lie beyond the cloud. And those genes are interesting, but they're very subtle. So I think it's an important message to take home today that even though we celebrate all of our differences, we are quite similar even at the brain level.
Now what do those differences look like? This is an example of a study that we did to follow up and see what exactly those differences were -- and they're quite subtle. These are things where genes are turned on in an individual cell type. These are two genes that we found as good examples. One is called RELN -- it's involved in early developmental cues. DISC1 is a gene that's deleted in schizophrenia. These aren't schizophrenic individuals, but they do show some population variation. And so what you're looking at here in donor one and donor four, which are the exceptions to the other two, that genes are being turned on in a very specific subset of cells. It's this dark purple precipitate within the cell that's telling us a gene is turned on there. Whether or not that's due to an individual's genetic background or their experiences, we don't know. Those kinds of studies require much larger populations.
So I'm going to leave you with a final note about the complexity of the brain and how much more we have to go. I think these resources are incredibly valuable. They give researchers a handle on where to go. But we only looked at a handful of individuals at this point. We're certainly going to be looking at more. I'll just close by saying that the tools are there, and this is truly an unexplored, undiscovered continent. This is the new frontier, if you will. And so for those who are undaunted, but humbled by the complexity of the brain, the future awaits.
(Applause)
脳は常に 人を魅了してきました 人は脳の構造を研究して記録し 図に描いて 地図を作りました さてGoogle MapsやGPSのように テクノロジーの恩恵に授かった 物理地図と同様に 脳マッピングも 今 変革の時を 迎えているのです
それでは脳を見てみましょう 新鮮な脳を見ると大抵の人は 「いつも見せてもらっているものと 少し違うな」と言います 通例 目にするものは灰色の固定標本なんです さて 外側は高度に発達した 脈管系です 赤い部分は血管です 肺から送りだされる酸素の20%と 心臓から送り出される血流の 20%がこの単一の 器官で消費されています 大きさはというと 拳2つをわずかに上回る程度です
研究者は20世紀の終わり頃に 血流を追跡することで 脳を侵襲することなく 脳の活動部位を特定するに至りました 例えば脳の 後方の部分には 垂直でいたり 立っていたりするなど 協調運動を司る小脳があります こちら側には側頭皮質が見えます ここで一次聴覚が処理され 聴き取った単語を高次の 言語処理センターに送りだします 脳の前方部では より複雑な思考や意志決定が行われます 成熟は最も遅く 成人期の後半です 全ての意志決定プロセスはここで処理されます 「今晩 ステーキは注文しない」 といった意志決定はこの部分で行われています
脳を掘り下げて その断面図を眺めてみると たいした脳構造は 見当たらないように見えますが ここにも脳構造はあるのです 細胞とケーブルは全て繋がっています 約100年前 研究者が 細胞を染める染色剤を開発しました 画面上の薄い青色の部分は 神経細胞体です 分布はとても不均等ですね もっと構造が見えます さて脳の外側には 新皮質があります これは一連の処理装置とでも呼びましょうか この下にもまだ見るものはたくさんあります そしてこの染色されていない部分は全て ワイヤー(軸索)が通っている部分で 細胞密度は低いはずです 脳内にはおよそ860億のニューロンが存在します ご覧の通り分布はとても不均等ですが この分布こそが脳の機能と 密接に関連しているのです もちろん説明した通り 脳機能マッピングが可能となり始め 個々の細胞を機能と結び付けることも始められます
それでは細かく見ていきましょう 初めにニューロンが見えてきます ニューロンの数は860億です より小さな細胞が見えてきますよ アストロサイトグリアという支持細胞です この神経自身が 入力情報を受信し 蓄え 処理します 脳内の各ニューロンはシナプスを通じて最大で 1万のニューロンと連結されます それぞれのニューロンが 独自性を備えています 各ニューロンと集合体としての ニューロンの特徴の両方を 決定しているのは表に見えない基本的な 生化学的性質なのです これはタンパク質です イオンチャンネルの動きを制御する働きがあり 神経細胞の連結を管理するだけではなく 神経系の機能は全て タンパク質がコントロールしています
更に倍率を上げて見ましょう すると タンパク質は全てゲノムに コード化されています 人間は23対の染色体を持っています 両親のそれぞれから一つずつを受け継ぎます この染色体の中には おおよそ25000の遺伝子があり 全てDNAとしてコード化されています 脳細胞がその基盤である 生化学的機能を左右する性質は この25000のうちのどの遺伝子が 活性化されているか またその活性化の度合いにより 決定されます
私たちのプロジェクトでは 活性化した遺伝子を 特定することを目指しています このプロジェクトにはもちろん 脳が必要となります 私たちは実験補助者を送り出して 正常な脳を探しています まずは死体が運び込まれる 検死官の事務所から 当たります 正常な人な脳を求めています 選定にはいくつもの基準があります 年齢は20から60歳 自然死した人で 脳には傷がついていないこと 精神疾患歴がないこと 薬物使用歴がないこと 加えて毒物学検査も行います 更に提供していただく脳にも 細心の注意を払っています この他 親族の同意の下 死後24時間以内に 脳組織を採取できる 脳を選んでいます 私たちの研究しているRNAというのは 遺伝子情報の読み出しなのですが 変性しやすいために すぐに処理しなくてはいけません
脳採集の豆知識になりますが 私たちの収集方法や 同意の必要性もあって 女性のものより男性の脳が多く手に入ります 男性が壮年に事故死する可能性は女性より高く 更に配偶者から 臓器提供の同意が得られるのは 得てして男性なのです
(笑)
さて脳を入手してまず初めにすることは MR画像の撮影です 磁気共鳴映像法と呼ばれるものです 標準データとして残りのデータの参照に使います こうして集めたMR画像は 脳の衛星画像だと思って下さい その次に行うのが 拡散テンソル画像の撮影です 脳内の線維連絡を画像化します こちらは言い方を変えれば 脳内の高速道路を映し出したものです 頭蓋骨から取り出された脳は 1cm厚にスライスされていきます このように凍結し シアトルに発送されます シアトルではというと この脳半球全部を ハイテクなミートスライサーにかけます この刃が 脳の組織をスライスし 顕微鏡のスライドグラスに乗せます その後 染色を施し スキャンにかけます こうして最初の地図が得られます
ここで専門家が基本的な 解剖学的特定を行います このきれいな縁取りを 州の境界とでも思って下さい ここから 更に脳を細分化していき 小型の凍結切片作成機にかけます これは凍結された脳を スライスしているところです 厚さは赤ん坊の髪と同じ20ミクロンです これでもまだ凍っているんですよ ご覧の通り少し時代遅れではありますが ブラシを使って スライドグラスの上に載せ 細心の注意を払ってこれを溶かします その後染色ロボットで 染色します 解剖学者たちがここから更に解析を行います
これは顕微鏡の画像です 脳内に点在する大小様々な細胞からなる 集合体や配置が 確認できますね ここから通常の方法で脳部位を特定していき 基準地図ができます これはもっと詳細な脳地図です
次に もうひとつの組織片を使い レーザー光で組織の一部を切り取ります ここでは技術者が切断する部位を 画面上でトレースし レーザー光で切断していきます 青い点が組織を切って 分離します スライドグラス上で 切断をしている最中の画像です 下には切断後の組織の受け皿があります 切断された組織を取り出し ここから基本的な技術を利用して RNAを精製します そしてこれを蛍光標識します 標識されたサンプルを マイクロアレイという機械で分析します
ただの点の集合体に見えるかもしれませんが それぞれの点が実は ガラス上に固定された ヒトゲノムの特定の断片なんです ここには約6万の要素がありますが ゲノム内の遺伝子を 反復して測定しています さて サンプルにハイブリッド形成すると サンプル中で活性化している 遺伝子の量を示す固有の「指紋」が得られます
この一連の作業を 1つの脳に何度も何度も繰り返します 1つの脳から取るサンプル数は1000を上回ります ご覧頂いているのは学習と記憶をつかさどる 海馬という部位です 1000のサンプルの内 約70がこの部位から得られます 各サンプルから5万程のデータが得られるので 1つの脳から取るサンプルの数約1000個からは
大体の値としては脳ひとつにつき データ数は5000万ということになります 現在までに2つの脳の データの解析が終わっています こうして得られたデータを全て統合し 1つにまとめ上げました 合わせたものがこちらです これは世界中の研究者に無償で公開されている 膨大な情報の集合体とでも言っておきましょう このツールを使ってデータを探索して 興味あることを発見するのにログインは不要です 次にデータの統合方法をご紹介します こちらの画像は先ほどもお見せしましたね このMR画像が枠組みになります 右側にあるツールバーを利用して 回転 倍率の変更 一つずつの構造をハイライトするなどの操作も可能です
しかしそれ以上に大切なのは この誰もが理解できる脳の解剖学的骨格に どの遺伝子が活性化されているかを書き加えたことです 赤い部位は遺伝子が 高度に活性化されている部位です 緑の部分は活動していない部分になります 一つずつの遺伝子の「指紋」が描けます お話しした通りゲノム中の25000の遺伝子すべてを解析しました その全てのデータを閲覧することができます
研究者はここから何を学べるでしょう? 私たち自身はデータの解析を始めたばかりです ご理解頂きたい基本的なことがらがあります プロザックとウェルブトリンは この上ない例です 2つとも広く処方されている抗うつ剤です 私たちの研究対象は遺伝子でしたね 遺伝子がタンパク質合成の指令をだします タンパク質こそが薬物の標的なのです 薬物はタンパク質に結合し 不活性化したりするのです 薬効を理解するには まず期待通りに薬物が作用しているか否かを 理解する必要があるのです 副作用に関しても どの遺伝子が 活性化されたか知る必要があります 初めてそれができるようになりました 複数の被験者からもデータが得られます
脳内をくまなく探索することができますし 固有の「指紋」を 確認することもできます セロトニン作動性の神経に働くことが知られている プロザックなどの薬物が実際に関連した遺伝子を 活性化していることが裏付けられます 脳全体を見る必要もあります 誰も調べたことのなかったような部位も調べる必要があります そしてそこで活性化されている遺伝子を知ることができます この上なく興味をそそる「副作用」です もう一つできることがあります この地図はパターンマッチングを利用しており それぞれに固有の「指紋」があるため このゲノム全体をスキャンして 類似した「指紋」を持つタンパク質を 検索することができます 例えば新薬開発を行う際には ゲノムの提供してくれる リスト全体を検討して よりよい薬物標的を見つけ最適化を図ることができます
皆さんのほとんどは 「最近ある研究者がXに 影響を及ぼす遺伝子を発見しました」というような ゲノムワイド関連解析についての ニュースを耳にしたことがあるでしょう このような素晴しい研究は 日常的に発表されています 多くの人を分析し ゲノム全体を分析して 遺伝子と因果関係のありそうな 活性化している いわゆる ホットスポットを探しているのです しかしここから得られるのは 単なる遺伝子名のリストに過ぎません その活動部位についての情報は皆無です ですから 私たちの地図はこういった研究者にとって 大変有益なものとなるでしょう この地図を利用して 活動部位の情報を得ることもできますし 以前は 単純にできなかった 遺伝子活性経路のようなものを見ることもできます
ここにいる皆さんはとりわけ 個性のもつ重要性をより一層理解できるでしょう 私たちは皆異なる 遺伝的背景を持ち 異なる人生を生きてきました しかし 実際には私たちの ゲノムの99%以上は似通っています 遺伝子レベルでは皆同じなんです 脳も生化学的レベルでは 類似であるということが 明らかになりつつあります この図を見てみると 99%とは言わないまでも90%程の相関は 有意に認められるので 概ね似ていると言えるでしょう 通常からから外れているものも ときに見受けられます こういった遺伝子は興味をそそるものの 差異はごく僅かなものです そこで今日皆さんに覚えて頂きたい 大切なメッセージとは 私たちの個性は祝福されているものの 脳という観点からすると とても似通っているという点です
さて 違いとはどんなものでしょうか? こちらはその違いに焦点を当てた 私たちの追跡調査の結果で これは個々の細胞で活性化されている遺伝子の様子ですが 違いはほんの僅かなものですね この2つの遺伝子はそれを示すよい例だと思います ひとつは初期発生の決定要因であるリーリンです DISC1 は統合失調症で 欠失の見られる遺伝子です これは統合失調症の患者さんからのサンプルではありませんが ばらつきがいくらか見られます ここでご覧頂いている ドナー1 とドナー4 ですが この2つは例外で 一部の特定の細胞だけで 遺伝子が活性化されています この細胞内の暗紫色の沈殿物が そこで遺伝子が活性化されていることを示しています この現象が個人の遺伝子的背景のせいか 経験のせいかということは わかっていません こういった研究では もっと多くの被験者が必要です
最後に脳の複雑さと これからの課題について 少し触れて終わりにしたいと思います これらのデータは大変有効なものです 研究者たちにこれからの 道筋を示してくれます しかし解析を行った被験者は指で数える程なので 私たちは解析を継続します 最後に一言だけ言わせて下さい ツールは出そろいました これは前人未踏の未知の大陸であり これは最前線とでも呼びましょうかね 新たな発見を恐れず 脳の複雑さに謙虚な方には 未来が待ち受けています
ありがとうございました
(拍手)
品詞分類
- 主語
- 動詞
- 助動詞
- 準動詞
- 関係詞等
TED 日本語
TED Talks
関連動画

うつやPTSDを予防できる新種の薬 | TED Talkレベッカ・ブラックマン
2019.04.17騒音が健康に有害な理由 ― そして私たちにできることマティアス・バスナー
2019.02.26さまよう心を鎮めるには | TED Talkアミシ・ジャー
2018.04.18鬱の友達と心を通わせるにはビル・バーナット
2018.03.23脳に良い変化をもたらす運動の効果ウェンディー・スズキ
おすすめ 12018.03.21物事の「良し悪し」は思い込みに過ぎないヘザー・ラニエ
おすすめ 12018.01.19脳が深い睡眠から更なる恩恵を得る方法ダン・ガーテンバーグ
2018.01.04うつを一人で抱え込まないでニッキー・ウェバー・アレン
2017.10.26長寿の秘訣は周囲の人との交流かもスーザン・ピンカー
2017.09.04脳はどのように美しさを判定するか?アンジャン・チャタジー
2017.08.22脳が「意識された現実」という幻覚を作り出す仕組みアニル・セス
2017.07.18注意を向けた時、脳では何が起きているのかメディ・オディカニ=セイドラー
2017.07.12ティーンエイジャーの登校時間を遅らせるべき理由とはウェンディ・トロクセル
2017.06.09死に直面したとき、人生に生きる価値を与えてくれるのはルーシー・カラニシ
おすすめ 12017.06.07最善の自己と最悪の自己の生物学ロバート・サポルスキー
2017.05.31メンタルヘルスを気遣うのは恥ずかしくなんかないサング・デリ
2017.05.26

洋楽 おすすめ
RECOMMENDS
洋楽歌詞
ステイザ・キッド・ラロイ、ジャスティン・ビーバー
洋楽最新ヒット2021.08.20スピーチレス~心の声ナオミ・スコット
洋楽最新ヒット2019.05.23シェイプ・オブ・ユーエド・シーラン
洋楽人気動画2017.01.30フェイデッドアラン・ウォーカー
洋楽人気動画2015.12.03ウェイティング・フォー・ラヴアヴィーチー
洋楽人気動画2015.06.26シー・ユー・アゲインウィズ・カリファ
洋楽人気動画2015.04.06シュガーマルーン5
洋楽人気動画2015.01.14シェイク・イット・オフテイラー・スウィフト
ポップス2014.08.18オール・アバウト・ザット・ベースメーガン・トレイナー
ポップス2014.06.11ストーリー・オブ・マイ・ライフワン・ダイレクション
洋楽人気動画2013.11.03コール・ミー・メイビーカーリー・レイ・ジェプセン
洋楽人気動画2012.03.01美しき生命コールドプレイ
洋楽人気動画2008.08.04バッド・デイ~ついてない日の応援歌ダニエル・パウター
洋楽人気動画2008.05.14サウザンド・マイルズヴァネッサ・カールトン
洋楽人気動画2008.02.19イッツ・マイ・ライフボン・ジョヴィ
ロック2007.10.11アイ・ウォント・イット・ザット・ウェイバックストリート・ボーイズ
洋楽人気動画2007.09.14マイ・ハート・ウィル・ゴー・オンセリーヌ・ディオン
洋楽人気動画2007.07.12ヒーローマライア・キャリー
洋楽人気動画2007.03.21オールウェイズ・ラヴ・ユーホイットニー・ヒューストン
洋楽人気動画2007.02.19オネスティビリー・ジョエル
洋楽人気動画2005.09.16