TED日本語
TED Talks(英語 日本語字幕付き動画)
TED日本語 - ゲリー・フレーク: Pivotはウェブ探索における分岐点となるか?
TED Talks
Pivotはウェブ探索における分岐点となるか?
is Pivot a turning point for web exploration?
ゲリー・フレーク
Gary Flake
内容
ゲリー・フレークがPivotのデモをお見せします。Pivotはネットにある膨大な画像やデータを整理し閲覧するためのソフトで、革新的技術Seadragonを基盤にしており、ウェブデータベースに自在にズームイン・ズームアウトして、通常のウェブブラウジングでは見えないパターンや関連の発見を可能にします。


字幕
SCRIPT
Script
If I can leave you with one big idea today, it's that the whole of the data in which we consume is greater that the sum of the parts, and instead of thinking about information overload, what I'd like you to think about is how we can use information so that patterns pop and we can see trends that would otherwise be invisible.
So what we're looking at right here is a typical mortality chart organized by age. This tool that I'm using here is a little experiment. It's called Pivot, and with Pivot what I can do is I can choose to filter in one particular cause of deaths -- say, accidents. And, right away, I see there's a different pattern that emerges. This is because, in the mid-area here, people are at their most active, and over here they're at their most frail. We can step back out again and then reorganize the data by cause of death, seeing that circulatory diseases and cancer are the usual suspects, but not for everyone. If we go ahead and we filter by age -- say 40 years or less -- we see that accidents are actually the greatest cause that people have to be worried about. And if you drill into that, it's especially the case for men.
So you get the idea that viewing information, viewing data in this way, is a lot like swimming in a living information info-graphic. And if we can do this for raw data, why not do it for content as well? So what we have right here is the cover of every single Sports Illustrated ever produced. It's all here; it's all on the web. You can go back to your rooms and try this after my talk. With Pivot, you can drill into a decade. You can drill into a particular year. You can jump right into a specific issue. So I'm looking at this; I see the athletes that have appeared in this issue, the sports. I'm a Lance Armstrong fan, so I'll go ahead and I'll click on that, which reveals, for me, all the issues in which Lance Armstrong's been a part of.
(Applause)
Now, if I want to just kind of take a peek at these, I might think, "Well, what about taking a look at all of cycling?" So I can step back, and expand on that. And I see Greg LeMond now. And so you get the idea that when you navigate over information this way -- going narrower, broader, backing in, backing out -- you're not searching, you're not browsing. You're doing something that's actually a little bit different. It's in between, and we think it changes the way information can be used.
So I want to extrapolate on this idea a bit with something that's a little bit crazy. What we're done here is we've taken every single Wikipedia page and we reduced it down to a little summary. So the summary consists of just a little synopsis and an icon to indicate the topical area that it comes from. I'm only showing the top 500 most popular Wikipedia pages right here. But even in this limited view, we can do a lot of things. Right away, we get a sense of what are the topical domains that are most popular on Wikipedia. I'm going to go ahead and select government. Now, having selected government, I can now see that the Wikipedia categories that most frequently correspond to that are Time magazine People of the Year. So this is really important because this is an insight that was not contained within any one Wikipedia page. It's only possible to see that insight when you step back and look at all of them.
Looking at one of these particular summaries, I can then drill into the concept of Time magazine Person of the Year, bringing up all of them. So looking at these people, I can see that the majority come from government; some have come from natural sciences; some, fewer still, have come from business -- there's my boss -- and one has come from music. And interestingly enough, Bono is also a TED Prize winner. So we can go, jump, and take a look at all the TED Prize winners. So you see, we're navigating the web for the first time as if it's actually a web, not from page-to-page, but at a higher level of abstraction.
And so I want to show you one other thing that may catch you a little bit by surprise. I'm just showing the New York Times website here. So Pivot, this application -- I don't want to call it a browser; it's really not a browser, but you can view web pages with it -- and we bring that zoomable technology to every single web page like this. So I can step back, pop right back into a specific section. Now the reason why this is important is because, by virtue of just viewing web pages in this way, I can look at my entire browsing history in the exact same way. So I can drill into what I've done over specific time frames. Here, in fact, is the state of all the demo that I just gave. And I can sort of replay some stuff that I was looking at earlier today. And, if I want to step back and look at everything, I can slice and dice my history, perhaps by my search history -- here, I was doing some nepotistic searching, looking for Bing, over here for Live Labs Pivot. And from these, I can drill into the web page and just launch them again. It's one metaphor repurposed multiple times, and in each case it makes the whole greater than the sum of the parts with the data.
So right now, in this world, we think about data as being this curse. We talk about the curse of information overload. We talk about drowning in data. What if we can actually turn that upside down and turn the web upside down, so that instead of navigating from one thing to the next, we get used to the habit of being able to go from many things to many things, and then being able to see the patterns that were otherwise hidden? If we can do that, then instead of being trapped in data, we might actually extract information. And, instead of dealing just with information, we can tease out knowledge. And if we get the knowledge, then maybe even there's wisdom to be found.
So with that, I thank you.
(Applause)
今日私が大きなアイデアを一つだけ お伝えできるとしたら、それは データの全体から我々が得られるものは、 部分の和よりも大きいということです。 情報過多ではなく、どうすれば 通常見えていないパターン、 傾向を見つけることが出来るのか 考えてみて下さい。
今ご覧頂いているのは典型的な 年齢別死亡率のグラフです。 今使っているツールは実験段階のもので、 Pivotです。これを使えばある特定の 死因のデータだけ抽出することができます。例えば事故。 そしてすぐ別の傾向があることを確認できます。 理由はここ、中ほどでは 人々は最も活動的で、次に こちら側では最も体が弱いからです。 前に戻って データを死因で並べなおすこともできます 循環器系疾患とガンが最も高いですが 全員に対してというわけではありません。 さらに年齢で絞って 40歳以下を見てみましょう 事故がその年代の人々にとって 最も注意すべき死因だとわかりますね。 特に男性が要注意であることもわかります。
さて皆さんお分かりいただけたと思います 情報やデータをこの様に眺めるのは 画像主体の情報の中を 泳いでいるみたいでしょ。 そして生のデータにこんなことができるなら コンテンツにもやってみませんか? そこでここにあるのは 今までに作られてきた スポーツ イラストレイテッド誌の表紙です。 すべてがここウェブ上にあります。 公演後皆さんの部屋でも同じことは出来ます。 Pivotで特定の10年分に絞り込むことができます。 ある1年に絞り込むこともできます。 あらゆる巻に即座に戻れます。 これを見てみましょう。この号に 掲載のあったアスリートが全部表示されています。 ランス アームストロングのファンなのでこれをクリックしてみましょう。 するとこの様にランス アームストロングが 取り上げられた全ての号が抽出されます。
(拍手)
ちょっと上の方を眺めてみたくなったとしましょう 「サイクリングについての記事を見てみようかな」 と思うかもしれません。 一歩下がって拡大しましょう。 するとグレッグ レモンが出てきます。 この様に情報を絞り込んだり 広げたり、戻ったりと情報を 自由に操作することは、単なる 検索やブラウジングではないと お分かり頂けたと思います。 これは実際少し異なるものなんです。 これは検索と閲覧の中間で、我々の 情報の利用方を変えてくれると思っています。
このアイデアを拡張して ちょっと極端なことをやってみましょう。 私たちはウィキペディアの全てのページを それぞれ小さな要約にまとめました。 要約は短い概要と、それが属する トピックを表すアイコンからなっています。 今ここでは最も人気のある 500ページしか載せていません。 しかしこの限られた範囲でも、 色々なことが出来ます。 直ぐに、ウィキペディア上で人気のある トピックを把握することができますね。 今から「政治」を選んでみます。 さて「政治」を選んでみると、 この様にウィキペディアのカテゴリーで 最も多く一致するのは雑誌Timeの Person of the Yearであると分かります。 これはウィキペディアのどのページにも含まれていない 情報ですから、とても重要なのです。 一歩下がって全てを見渡してみた時 初めてこの様な見方が可能となるのです。
要約の1つを見てみましょう そこからPerson of the Yearの カテゴリに進み、それに 属するもの全てを表示できます。 そこで彼らを見てみて下さい、 多くの人は政治関係だとわかりますね。 何人かは自然科学関係ですね。 さらに少ないですが、ビジネス関係の人もいます。 私のボスもいます。 それから音楽方面の人が1人います。 そして面白いことに、ボノは TED Prize受賞者でもあります。この様に 自由にTED Prize受賞者を全員見渡せます。 ご覧頂いたように、我々は初めてwebを ページからページではなく、一つのwebとして 高い抽象レベルでナビゲートしているのです。
そこでもう一つ 皆さんが 驚くだろうものを お見せしたいと思います。 ここにNew York Timesのホームページがあります。 そこでこのアプリケーションPivot--これを ブラウザーとは呼びたくないです。違いますから。 しかし勿論ウェブの閲覧は可能ですけど-- 私たちはこの様にズーム技術をそれぞれの webページに使えるようにしました。 一歩下がって眺め、目的の部分に 飛び込むことができます。 さてこれが重要な理由としては、 この様にウェブを閲覧することによって 閲覧履歴全体を全く同じように 見ることができるからです。 だから特定の時間帯にしたことを 掘り下げることができます。 実際ここには今日実演してきた ページの履歴が見えますね。 すると先ほどお見せしたものをリプレイすることもできます。 一歩下がって全て見たいと思ったら、 履歴をスライス&ダイスすることができ、 例えば検索履歴を取り出すことができます。 私は身内びいきの 検索をしていますね。 その履歴から、すぐに元をたどり 再起動することができます。 1つのメタファが形を変えて何度も 現れています。すなわち全体というのは 部分の和よりも大きいということです。
現在我々は世界に溢れかえるデータを 悪と捉えています。 情報過多は災いであり 情報に溺れていると言われています。 それをひっくり返せないでしょうか webというものをひっくり返して 一つの物から次の物への単純な移動ではなく 多くの情報から多くの情報へと行き来することに慣れたなら それまで見えなかったパターンを 見いだせるようになるでしょう。 これが可能ならば、データに埋もれるのではなく 適切な情報抽出が可能かもしれません。 そうすれば単なる情報処理ではなく、 知識を引き出すことができます。 その知識が引き出せるなら、知恵だって見いだせるかもしれません。
以上です。ありがとう。
(拍手)
品詞分類
- 主語
- 動詞
- 助動詞
- 準動詞
- 関係詞等
TED 日本語
TED Talks
関連動画

10分で分かる量子コンピュータショヒーニ・ゴーシュ
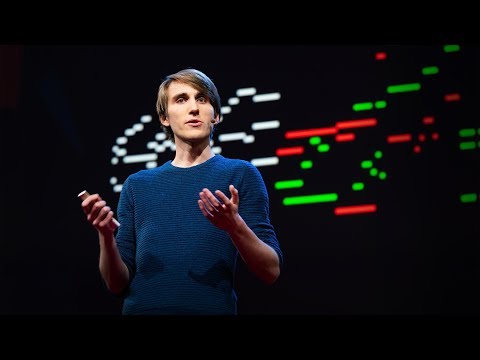
2019.02.01あなたの人生にサウンドトラックを付けてくれるAIピエール・バロー
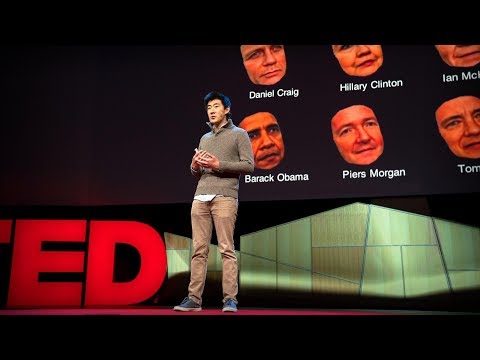
2018.10.01実在の人物の偽映像の作り方と、その見分け方スパソーン・スワジャナコーン
おすすめ 12018.07.25AIはいかに人の記憶、仕事、社会生活を改善するかトム・グルーバー
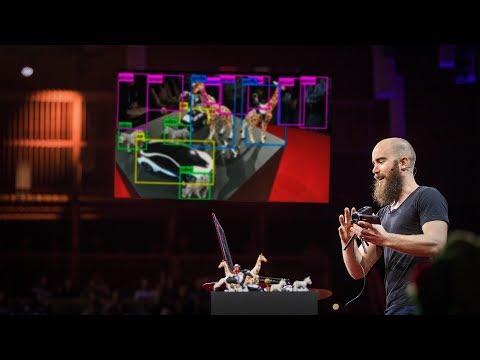
2017.08.21コンピューターはいかに物体を即座に認識できるようになったのかジョセフ・レドモン
2017.08.18知性を持つ機械を恐れるな、協働せよガルリ・カスパロフ
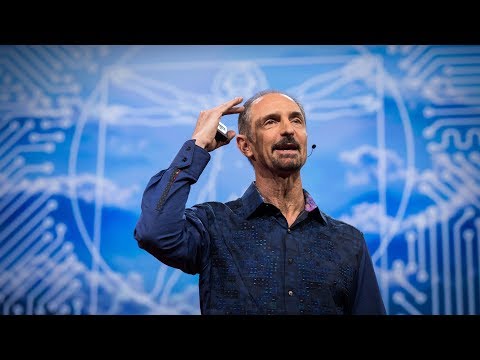
2017.06.20人工知能が人間を超えるのを怖れることはないグラディ・ブーチ
2017.03.13直感を持った人工知能が生み出すすごい発明モーリス・コンティ
2017.02.28表計算ソフト誕生の話ダン・ブリックリン
2017.02.01機械知能は人間の道徳性をより重要なものにするゼイナップ・トゥフェックチー
2016.11.11コンピューターはこうしてクリエイティブになるブレイス・アグエラ・ヤルカス
2016.07.22Linuxの背後にある精神リーナス・トーバルズ
2016.05.03ホログラム時代の未来にあるものアレックス・キップマン
2016.04.18拡張現実ヘッドセットを通して未来を覗くメロン・グリベッツ
2016.04.11形状変化テクノロジーが仕事を革新するショーン・フォルマー
2016.03.01インターネットをスクリーンなしで見るとトム・アグロ―
2015.11.13


洋楽 おすすめ
RECOMMENDS
洋楽歌詞
ダイナマイトビーティーエス
洋楽最新ヒット2020.08.20ディス・イズ・ミーグレイテスト・ショーマン・キャスト
洋楽人気動画2018.01.11グッド・ライフGイージー、ケラーニ
洋楽人気動画2017.01.27ホワット・ドゥ・ユー・ミーン?ジャスティン・ビーバー
洋楽人気動画2015.08.28ファイト・ソングレイチェル・プラッテン
洋楽人気動画2015.05.19ラヴ・ミー・ライク・ユー・ドゥエリー・ゴールディング
洋楽人気動画2015.01.22アップタウン・ファンクブルーノ・マーズ、マーク・ロンソン
洋楽人気動画2014.11.20ブレイク・フリーアリアナ・グランデ
洋楽人気動画2014.08.12ハッピーファレル・ウィリアムス
ポップス2014.01.08カウンティング・スターズワンリパブリック
ロック2013.05.31ア・サウザンド・イヤーズクリスティーナ・ペリー
洋楽人気動画2011.10.26ユー・レイズ・ミー・アップケルティック・ウーマン
洋楽人気動画2008.05.30ルーズ・ユアセルフエミネム
洋楽人気動画2008.02.21ドント・ノー・ホワイノラ・ジョーンズ
洋楽人気動画2008.02.15オンリー・タイムエンヤ
洋楽人気動画2007.10.03ミス・ア・シングエアロスミス
ロック2007.08.18タイム・トゥ・セイ・グッバイサラ・ブライトマン
洋楽人気動画2007.06.08シェイプ・オブ・マイ・ハートスティング
洋楽人気動画2007.03.18ウィ・アー・ザ・ワールド(U.S.A. フォー・アフリカ)マイケル・ジャクソン
洋楽人気動画2006.05.14ホテル・カリフォルニアイーグルス
ロック2005.07.06