TED日本語
TED Talks(英語 日本語字幕付き動画)
TED日本語 - ピーター・ヴァン・マネン: フォーミュラ1が赤ちゃんを救う?
TED Talks
フォーミュラ1が赤ちゃんを救う?
How can Formula 1 racing help ... babies?
ピーター・ヴァン・マネン
Peter van Manen
内容
フォーミュラ1のレーシングカーは、1レース走行中に何億ものデータポイントをピット・ガレージに送信し、リアルタイムでの分析・フィードバックを受けます。この詳細で緻密なデータシステムを他でも応用しない手はありません――例えば、小児病院で。ピーター・ヴァン・マネンが語ります。


字幕
SCRIPT
Script

Motor racing is a funny old business. We make a new car every year, and then we spend the rest of the season trying to understand what it is we've built to make it better, to make it faster. And then the next year, we start again.
Now, the car you see in front of you is quite complicated. The chassis is made up of about 11,000 components, the engine another 6,000, the electronics about eight and a half thousand. So there's about 25,000 things there that can go wrong. So motor racing is very much about attention to detail.
The other thing about Formula 1 in particular is we're always changing the car. We're always trying to make it faster. So every two weeks, we will be making about 5,000 new components to fit to the car. Five to 10 percent of the race car will be different every two weeks of the year.
So how do we do that? Well, we start our life with the racing car. We have a lot of sensors on the car to measure things. On the race car in front of you here there are about 120 sensors when it goes into a race. It's measuring all sorts of things around the car. That data is logged. We're logging about 500 different parameters within the data systems, about 13,000 health parameters and events to say when things are not working the way they should do, and we're sending that data back to the garage using telemetry at a rate of two to four megabits per second. So during a two-hour race, each car will be sending 750 million numbers. That's twice as many numbers as words that each of us speaks in a lifetime. It's a huge amount of data.
But it's not enough just to have data and measure it. You need to be able to do something with it. So we've spent a lot of time and effort in turning the data into stories to be able to tell, what's the state of the engine, how are the tires degrading, what's the situation with fuel consumption? So all of this is taking data and turning it into knowledge that we can act upon.
Okay, so let's have a look at a little bit of data. Let's pick a bit of data from another three-month-old patient. This is a child, and what you're seeing here is real data, and on the far right-hand side, where everything starts getting a little bit catastrophic, that is the patient going into cardiac arrest. It was deemed to be an unpredictable event. This was a heart attack that no one could see coming. But when we look at the information there, we can see that things are starting to become a little fuzzy about five minutes or so before the cardiac arrest. We can see small changes in things like the heart rate moving. These were all undetected by normal thresholds which would be applied to data. So the question is, why couldn't we see it? Was this a predictable event? Can we look more at the patterns in the data to be able to do things better?
So this is a child, about the same age as the racing car on stage,three months old. It's a patient with a heart problem. Now, when you look at some of the data on the screen above, things like heart rate, pulse, oxygen, respiration rates, they're all unusual for a normal child, but they're quite normal for the child there, and so one of the challenges you have in health care is, how can I look at the patient in front of me, have something which is specific for her, and be able to detect when things start to change, when things start to deteriorate? Because like a racing car, any patient, when things start to go bad, you have a short time to make a difference.
So what we did is we took a data system which we run every two weeks of the year in Formula 1 and we installed it on the hospital computers at Birmingham Children's Hospital. We streamed data from the bedside instruments in their pediatric intensive care so that we could both look at the data in real time and, more importantly, to store the data so that we could start to learn from it. And then, we applied an application on top which would allow us to tease out the patterns in the data in real time so we could see what was happening, so we could determine when things started to change.
Now, in motor racing, we're all a little bit ambitious, audacious, a little bit arrogant sometimes, so we decided we would also look at the children as they were being transported to intensive care. Why should we wait until they arrived in the hospital before we started to look? And so we installed a real-time link between the ambulance and the hospital, just using normal 3G telephony to send that data so that the ambulance became an extra bed in intensive care.
And then we started looking at the data. So the wiggly lines at the top, all the colors, this is the normal sort of data you would see on a monitor -- heart rate, pulse, oxygen within the blood, and respiration. The lines on the bottom, the blue and the red, these are the interesting ones. The red line is showing an automated version of the early warning score that Birmingham Children's Hospital were already running. They'd been running that since 2008, and already have stopped cardiac arrests and distress within the hospital. The blue line is an indication of when patterns start to change, and immediately, before we even started putting in clinical interpretation, we can see that the data is speaking to us. It's telling us that something is going wrong.
The plot with the red and the green blobs, this is plotting different components of the data against each other. The green is us learning what is normal for that child. We call it the cloud of normality. And when things start to change, when conditions start to deteriorate, we move into the red line. There's no rocket science here. It is displaying data that exists already in a different way, to amplify it, to provide cues to the doctors, to the nurses, so they can see what's happening. In the same way that a good racing driver relies on cues to decide when to apply the brakes, when to turn into a corner, we need to help our physicians and our nurses to see when things are starting to go wrong.
So we have a very ambitious program. We think that the race is on to do something differently. We are thinking big. It's the right thing to do. We have an approach which, if it's successful, there's no reason why it should stay within a hospital. It can go beyond the walls. With wireless connectivity these days, there is no reason why patients, doctors and nurses always have to be in the same place at the same time. And meanwhile, we'll take our little three-month-old baby, keep taking it to the track, keeping it safe, and making it faster and better.
Thank you very much.
(Applause)
カーレースの世界は面白いものです 毎年 新しいレーシングカーを作っては 残りのシーズン全てを使って どうやったら そのマシンを良く 速くできるかを模索していきます そして 次の年になれば同じことを繰り返します
目の前にあるレーシングカーはかなり複雑な構造をしています シャシーは1万1千もの部品からなり エンジンだけで6千 電気系は8千5百の部品を使っています つまり 故障を招きかねない部品が2万5千もあるわけです カーレースは まさに細部にいかに注意を払えるかです
特にフォーミュラ1に関しては 常にマシンに手を加えて 速くしようとしています 2週間ごとに そのマシンに使う― 部品を 5千も新調しています レーシングカーの5~10%が 一年を通じて 2週間ごとに変わっていくわけです
どうやってやるのか? まず レーシングカーから始めます 車体にたくさんの計測センサーをつけます ここにあるレーシングカーで言えば レースで走るときにはおよそ120のセンサーをつけます そのマシンに関する あらゆることを計測し データが記録されます記録するのは データーシステム内の500のパラメーター 1万3千の異常察知パラメーターそして 予定通りに動いていないことを示す事象です それらのデータは ピット・ガレージに 無線で 毎秒2~4メガビットの速度でデータが送られます つまり 2時間のレースで 各マシンは 7.5億もの数字を送信するのです それは 私たちが一生で話す単語の数の 2倍に当たります ものすごい量のデータです
でも データを取り 計測するだけでは十分ではなく それで何かができないといけません だから 私たちは多くの時間と労力を費やして データから 様々なことが 語れるようにしてきましたエンジンの状態がどうだとか タイヤのすり減り具合がどうだとか 燃料消費がどうか といったことです 要するに データを取って それを 行動に結び付けられる情報に変えるのです
では データについてちょっと見てみましょう こちらで見るのは 生後3ヶ月の患者のデータです これは子どもで今ご覧いただいているのは実際のデータです 画面の右側に行くと いろんなことが ぐちゃぐちゃになっています 患者が心不全になっていっているのです これは予見できないこととされていました 誰も予期しえない心臓発作でした でも ここの情報を見れば 心不全になる5分ほどくらい前から 少し乱れてきているのが分かります 小さな変化が見て取れます 例えば 心拍数もそうです これらは全て通常備わっている異常検知機能では 検知されませんでした では なぜ 分からなかったのでしょう? これは予期しうる出来事だったのでしょうか? データのパターンをもっとよく見たら 助けるために何かできたのでしょうか?
この子は ここにあるレーシングカーとほぼ同じで 生後3ヶ月です この子は心臓に問題がありました 上のスクリーンに表示されているデータ 心拍数や脈拍 酸素 呼吸数などを見ると それらは全て普通の子どもとは違います でも この子にとっては それが普通なのです 医療における課題の一つは 目の前にいる患者を診て その患者特有の状態を把握し 状態が変わり悪化しそうなときを どうやって見出すかなのです レーシングカーのように どの患者も 容体が悪くなり始めたら手を打つのに もう一刻の猶予もありません
そこで私たちが行ったのがフォーミュラ1で 2週間ごとに稼働させるデータシステムを 病院のコンピュータに導入することでした バーミンガム小児病院で行いました 小児集中治療で使われている― ベッドサイドモニタからデータをストリーミングし リアルタイムでデータを見ると同時に こちらがより重要ですがデータを蓄積して そこから学習できるようにしました まず アプリケーションを適用してリアルタイムで データからパターンを認識できるようにしました 何が起こっているか見て 変化が起こりそうなときを察知するためです
カーレースではみんな ちょっと野心に満ちていて 恐れを知らず 時にちょっと傲慢です だから 私たちは病院に救急搬送されてくる― 子どもたちも見ることにしました 病院に到着するまで 待たないといけない理由なんてないでしょう そこで リアルタイムのネットワークを 救急車と病院との間でも作りました 通常の3G回線を使ってデータを送るのです 救急車が まさに集中治療室の ベッドになるのです
私たちはデータを分析し始めました 上のグラフにある いろんな色の波線は 通常 モニターで見るデータで 心拍数 脈拍 血中酸素濃度 呼吸数です 下にある 青と赤色のラインが 興味深いものです 赤のラインは 自動で算出された― 早期警告スコアで バーミンガム小児病院ではすでに使用しています 2008年から導入していて 病院内での 心不全や 心停止を防いできました 青のラインが示すのは パターンの変化で それは即座に見て取れます 医学的な解釈をするまでもなく データが語りかけるのです データは 何かがおかしいと訴えています
そして 赤と緑の固まりで示されているのは 細かなデータを それぞれ互いに プロットしたものです 緑色は その子にとっては普通の範囲のことで 「通常のクラウド」と呼んでいます 状態が変わり始める― 状態が悪くなり始めると ラインは赤色になります ここに高度な科学はありません すでにあるデータを違った形で表示しているだけです データを増幅させ医者や看護師に手がかりを与え 何が起こっているか可視化するのです 同じように 優秀なレーシング・ドライバーは こうした手がかりを頼りにブレーキや コーナーを曲がるタイミングを 判断しています 医者や看護師が問題を察知できるよう 手助けする必要があります
私たちには とても野心的なプログラムがあります もう 変革に向けたレースが始まっているのです 大きなことを考えていますがそうすべきなんです 私たちのアプローチはもしうまく行けば 病院の中だけで終わりません その壁を越え 広めることができます 今のように ワイヤレス接続の環境があれば 患者や医者 看護師たちが 常に 同じ場所にいる必要はありませんし 全員が一緒にいなくてもいいんです そして 私たちの3ヶ月のかわいい車も レース場で走らせ 安全を確保しながら より速く より良いものにしていくのです
ありがとうございました
(拍手)
品詞分類
- 主語
- 動詞
- 助動詞
- 準動詞
- 関係詞等
TED 日本語
TED Talks
関連動画

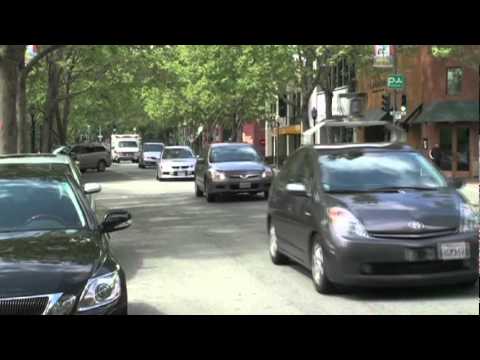
自動運転車は周りの世界をどう見ているのかクリス・アームソン
2015.06.263Dプリンタで作るジャンボ・ジェット機?バスティアン・シェーファー
2013.07.29もし車が話せたら事故は避けられるジェニファー・ヒーリー
2013.04.25原付スケートボードサンジェイ・ダストゥア
2013.04.02未来のレーシングカークリス・ガーデス
2012.07.11道路を走れる飛行機をつくるアナ・ムラチェク・ディートリック
2011.11.02視覚障害者が運転できる車を作るデニス・ホン
2011.06.03Googleの自動運転車で目指していることセバスチャン・スラン
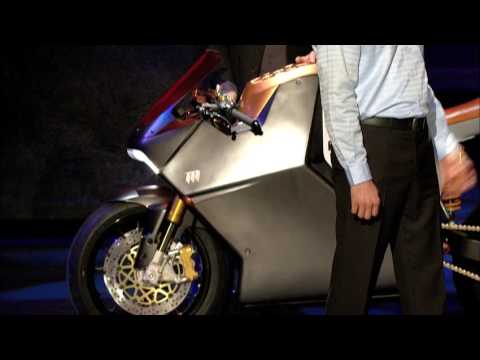
2011.03.31スーパー電気バイクのデザインイヴ・べアール
2009.05.22シャイ・アガシの電気自動車に対する大胆な計画
2009.04.13

洋楽 おすすめ
RECOMMENDS
洋楽歌詞
ステイザ・キッド・ラロイ、ジャスティン・ビーバー
洋楽最新ヒット2021.08.20スピーチレス~心の声ナオミ・スコット
洋楽最新ヒット2019.05.23シェイプ・オブ・ユーエド・シーラン
洋楽人気動画2017.01.30フェイデッドアラン・ウォーカー
洋楽人気動画2015.12.03ウェイティング・フォー・ラヴアヴィーチー
洋楽人気動画2015.06.26シー・ユー・アゲインウィズ・カリファ
洋楽人気動画2015.04.06シュガーマルーン5
洋楽人気動画2015.01.14シェイク・イット・オフテイラー・スウィフト
ポップス2014.08.18オール・アバウト・ザット・ベースメーガン・トレイナー
ポップス2014.06.11ストーリー・オブ・マイ・ライフワン・ダイレクション
洋楽人気動画2013.11.03コール・ミー・メイビーカーリー・レイ・ジェプセン
洋楽人気動画2012.03.01美しき生命コールドプレイ
洋楽人気動画2008.08.04バッド・デイ~ついてない日の応援歌ダニエル・パウター
洋楽人気動画2008.05.14サウザンド・マイルズヴァネッサ・カールトン
洋楽人気動画2008.02.19イッツ・マイ・ライフボン・ジョヴィ
ロック2007.10.11アイ・ウォント・イット・ザット・ウェイバックストリート・ボーイズ
洋楽人気動画2007.09.14マイ・ハート・ウィル・ゴー・オンセリーヌ・ディオン
洋楽人気動画2007.07.12ヒーローマライア・キャリー
洋楽人気動画2007.03.21オールウェイズ・ラヴ・ユーホイットニー・ヒューストン
洋楽人気動画2007.02.19オネスティビリー・ジョエル
洋楽人気動画2005.09.16