TED日本語
TED Talks(英語 日本語字幕付き動画)
TED日本語 - デイビッド・マッケイ: 再生可能エネルギーの現実
TED Talks
再生可能エネルギーの現実
A reality check on renewables
デイビッド・マッケイ
David Mackay
内容
イギリスのような国のエネルギーを、再生可能エネルギーで賄うためにはどの位の面積が必要でしょうか。答えは「国土のほぼ全て」です。デイビッド・マッケイは、選択可能ないくつかの再生エネルギーに関して、どのような制約があるのか、簡単な数式を用いて明らかにします。そして制約にも関わらず、再生可能エネルギーが必要である理由を説明しています。(TEDxWarwick)


字幕
SCRIPT
Script

When the Industrial Revolution started, the amount of carbon sitting underneath Britain in the form of coal was as big as the amount of carbon sitting under Saudi Arabia in the form of oil, and this carbon powered the Industrial Revolution, it put the "Great" in Great Britain, and led to Britain's temporary world domination. And then, in 1918, coal production in Britain peaked, and has declined ever since. In due course, Britain started using oil and gas from the North Sea, and in the year 2000, oil and gas production from the North Sea also peaked, and they're now on the decline.
These observations about the finiteness of easily accessible, local, secure fossil fuels, this is a motivation for saying, "Well, what's next? What is life after fossil fuels going to be like? Shouldn't we be thinking hard about how to get off fossil fuels?" Another motivation, of course, is climate change.
And when people talk about life after fossil fuels and climate change action, I think there's a lot of fluff, a lot of greenwash, a lot of misleading advertising, and I feel a duty as a physicist to try to guide people around the claptrap and help people understand the actions that really make a difference and to focus on ideas that do add up.
Let me illustrate this with what physicists call a back-of-envelope calculation. We love back-of-envelope calculations. You ask a question, you write down some numbers, and you get yourself an answer. It may not be very accurate, but it may make you say, "Hmm." So here's a question: Imagine if we said, "Oh yes, we can get off fossil fuels. We'll use biofuels. Problem solved. Transport, we don't need oil anymore." Well, what if we grew the biofuels for a road on the grass verge at the edge of the road? How wide would the verge have to be for that to work out?
Okay, so let's put in some numbers. Let's have our cars go at 60 miles per hour. Let's say they do 30 miles per gallon. That's the European average for new cars. Let's say the productivity of biofuel plantations is 1,200 litres of biofuel per hectare per year. That's true of European biofuels. And let's imagine the cars are spaced 80 meters apart from each other, and they're just perpetually going along this road. The length of the road doesn't matter, because the longer the road, the more biofuel plantation we've got. What do we do with these numbers? Well, you take the first number, and you divide by the other three, and you get eight kilometers. And that's the answer. That's how wide the plantation would have to be, given these assumptions. And maybe that makes you say, "Hmm. Maybe this isn't going to be quite so easy."
And it might make you think, perhaps there's an issue to do with areas, and in this talk, I'd like to talk about land areas, and ask, is there an issue about areas? The answer is going to be yes but it depends which country you are in.
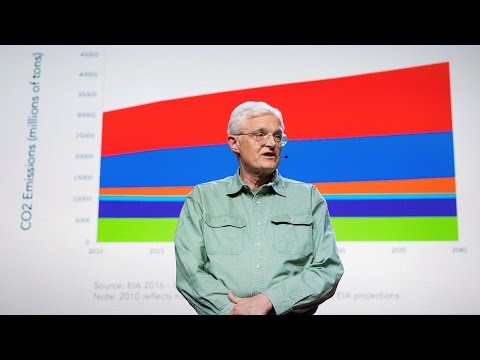
So let's start in the United Kingdom, since that's where we are today. The energy consumption of the United Kingdom, the total energy consumption, not just transport, but everything, I like to quantify it in light bulbs. It's as if we've all got 125 light bulbs on all the time,125 kilowatt-hours per day per person is the energy consumption of the U.K. So there's 40 light bulbs' worth for transport,40 light bulbs' worth for heating, and 40 light bulbs' worth for making electricity, and other things are relatively small compared to those three big fish. It's actually a bigger footprint if we take into account the embodied energy in the stuff we import into our country as well, and 90 percent of this energy today still comes from fossil fuels, and 10 percent only from other, greener -- possibly greener -- sources like nuclear power and renewables.
So, that's the U.K., and the population density of the U.K. is 250 people per square kilometer, and I'm now going to show you other countries by these same two measures. On the vertical axis, I'm going to show you how much light bulbs -- what our energy consumption per person is, and we're at 125 light bulbs per person, and that little blue dot there is showing you the land area of the United Kingdom, and the population density is on the horizontal axis, and we're 250 people per square kilometer. Let's add European countries in blue, and you can see there's quite a variety. I should emphasize, both of these axes are logarithmic. As you go from one gray bar to the next gray bar you're going up a factor of 10. Next, let's add Asia in red, the Middle East and North Africa in green, sub-Saharan Africa in blue, black is South America, purple is Central America, and then in pukey-yellow, we have North America, Australia and New Zealand. And you can see the great diversity of population densities and of per capita consumptions. Countries are different from each other.
Top left, we have Canada and Australia, with enormous land areas, very high per capita consumption,200 or 300 light bulbs per person, and very low population densities. Top right, Bahrain has the same energy consumption per person, roughly, as Canada, over 300 light bulbs per person, but their population density is a factor of 300 times greater,1,000 people per square kilometer. Bottom right, Bangladesh has the same population density as Bahrain but consumes 100 times less per person.
Bottom left, well, there's no one. But there used to be a whole load of people. Here's another message from this diagram. I've added on little blue tails behind Sudan, Libya, China, India, Bangladesh. That's 15 years of progress. Where were they 15 years ago, and where are they now? And the message is, most countries are going to the right, and they're going up, up and to the right -- bigger population density and higher per capita consumption. So, we may be off in the top right-hand corner, slightly unusual, the United Kingdom accompanied by Germany, Japan, South Korea, the Netherlands, and a bunch of other slightly odd countries, but many other countries are coming up and to the right to come and join us, so we're a picture, if you like, of what the future energy consumption might be looking like in other countries too.
And I've also added in this diagram now some pink lines that go down and to the right. Those are lines of equal power consumption per unit area, which I measure in watts per square meter. So, for example, the middle line there,0.1 watts per square meter, is the energy consumption per unit area of Saudi Arabia, Norway, Mexico in purple, and Bangladesh 15 years ago, and half of the world's population lives in countries that are already above that line. The United Kingdom is consuming 1.25 watts per square meter. So's Germany, and Japan is consuming a bit more.
So, let's now say why this is relevant. Why is it relevant? Well, we can measure renewables in the same units and other forms of power production in the same units, and renewables is one of the leading ideas for how we could get off our 90 percent fossil fuel habit. So here come some renewables. Energy crops deliver half a watt per square meter in European climates. What does that mean? And you might have anticipated that result, given what I told you about the biofuel plantation a moment ago. Well, we consume 1.25 watts per square meter. What this means is, even if you covered the whole of the United Kingdom with energy crops, you couldn't match today's energy consumption. Wind power produces a bit more,2.5 watts per square meter, but that's only twice as big as 1.25 watts per square meter, so that means if you wanted literally to produce total energy consumption in all forms on average from wind farms, you need wind farms half the area of the U.K. I've got data to back up all these assertions, by the way.
Next, let's look at solar power. Solar panels, when you put them on a roof, deliver about 20 watts per square meter in England. If you really want to get a lot from solar panels, you need to adopt the traditional Bavarian farming method where you leap off the roof and coat the countryside with solar panels too. Solar parks, because of the gaps between the panels, deliver less. They deliver about 5 watts per square meter of land area. And here's a solar park in Vermont with real data delivering 4.2 watts per square meter. Remember where we are,1.25 watts per square meter, wind farms 2.5, solar parks about five. So, whatever, whichever of those renewables you pick, the message is, whatever mix of those renewables you're using, if you want to power the U.K. on them, you're going to need to cover something like 20 percent or 25 percent of the country with those renewables. And I'm not saying that's a bad idea. We just need to understand the numbers. I'm absolutely not anti-renewables. I love renewables. But I'm also pro-arithmetic. (Laughter)
Concentrating solar power in deserts delivers larger powers per unit area, because you don't have the problem of clouds, and so this facility delivers 14 watts per square meter, this one 10 watts per square meter, and this one in Spain 5 watts per square meter. Being generous to concentrating solar power, I think it's perfect credible it could deliver 20 watts per square meter. So that's nice. Of course, Britain doesn't have any deserts. Yet. (Laughter)
So here's a summary so far. All renewables, much as I love them, are diffuse. They all have a small power per unit area, and we have to live with that fact. And that means, if you do want renewables to make a substantial difference for a country like the United Kingdom on the scale of today's consumption, you need to be imagining renewable facilities that are country-sized, not the entire country but a fraction of the country, a substantial fraction.
There are other options for generating power as well which don't involve fossil fuels. So there's nuclear power, and on this Ordnance Survey map, you can see there's a Sizewell B inside a blue square kilometer. That's one gigawatt in a square kilometer, which works out to 1,000 watts per square meter. So by this particular metric, nuclear power isn't as intrusive as renewables.
Of course, other metrics matter too, and nuclear power has all sorts of popularity problems. But the same goes for renewables as well. Here's a photograph of a consultation exercise in full swing in the little town of Penicuik just outside Edinburgh, and you can see the children of Penicuik celebrating the burning of the effigy of the windmill. So people are anti-everything, and we've got to keep all the options on the table.
What can a country like the U.K. do on the supply side? Well, the options are, I'd say, these three: power renewables, and recognizing that they need to be close to country-sized; other people's renewables, so we could go back and talk very politely to the people in the top left-hand side of the diagram and say, "Uh, we don't want renewables in our backyard, but, um, please could we put them in yours instead?" And that's a serious option. It's a way for the world to handle this issue. So countries like Australia, Russia, Libya, Kazakhstan, could be our best friends for renewable production. And a third option is nuclear power. So that's some supply side options.
In addition to the supply levers that we can push, and remember, we need large amounts, because at the moment, we get 90 percent of our energy from fossil fuels. In addition to those levers, we could talk about other ways of solving this issue, namely, we could reduce demand, and that means reducing population -- I'm not sure how to do that -- or reducing per capita consumption.
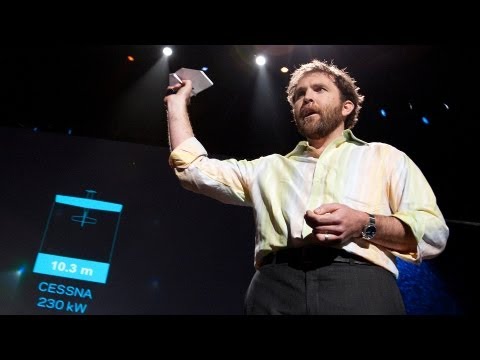
So let's talk about three more big levers that could really help on the consumption side. First, transport. Here are the physics principles that tell you how to reduce the energy consumption of transport, and people often say, "Oh, yes, technology can answer everything. We can make vehicles that are a hundred times more efficient." And that's almost true. Let me show you.
The energy consumption of this typical tank here is 80 kilowatt-hours per hundred person kilometers. That's the average European car. Eighty kilowatt-hours. Can we make something a hundred times better by applying those physics principles I just listed? Yes. Here it is. It's the bicycle. It's 80 times better in energy consumption, and it's powered by biofuel, by Weetabix. (Laughter) And there are other options in between, because maybe the lady in the tank would say, "No, no, no, that's a lifestyle change. Don't change my lifestyle, please." So, well, we could persuade her to get into a train, and that's still a lot more efficient than a car, but that might be a lifestyle change, or there's the eco-car, top-left. It comfortably accommodates one teenager and it's shorter than a traffic cone, and it's almost as efficient as a bicycle as long as you drive it at 15 miles per hour. In between, perhaps some more realistic options on this lever, transport lever, are electric vehicles, so electric bikes and electric cars in the middle, perhaps four times as energy efficient as the standard petrol-powered tank.
Next, there's the heating lever. Heating is a third of our energy consumption in Britain, and quite a lot of that is going into homes and other buildings doing space heating and water heating. So here's a typical crappy British house. It's my house, with the Ferrari out front. What can we do to it? Well, the laws of physics are written up there, which describe what -- how the power consumption for heating is driven by the things you can control. The things you can control are the temperature difference between the inside and the outside, and there's this remarkable technology called a thermostat. You grasp it, you rotate it to the left, and your energy consumption in the home will decrease. I've tried it. It works. Some people call it a lifestyle change. You can also get the fluff men in to reduce the leakiness of your building -- put fluff in the walls, fluff in the roof, and a new front door and so forth, and the sad truth is, this will save you money. That's not sad, that's good, but the sad truth is, it'll only get about 25 percent of the leakiness of your building, if you do these things, which are good ideas. If you really want to get a bit closer to Swedish building standards with a crappy house like this, you need to be putting external insulation on the building as shown by this block of flats in London. You can also deliver heat more efficiently using heat pumps which use a smaller bit of high grade energy like electricity to move heat from your garden into your house.
The third demand side option I want to talk about, the third way to reduce energy consumption is, read your meters. And people talk a lot about smart meters, but you can do it yourself. Use your own eyes and be smart, read your meter, and if you're anything like me, it'll change your life. Here's a graph I made. I was writing a book about sustainable energy, and a friend asked me, "Well how much energy do you use at home?" And I was embarrassed. I didn't actually know. And so I started reading the meter every week, and the old meter readings are shown in the top half of the graph, and then 2007 is shown in green at the bottom, and that was when I was reading the meter every week, and my life changed, because I started doing experiments and seeing what made a difference, and my gas consumption plummeted because I started tinkering with the thermostat and the timing on the heating system, and I knocked more than a half off my gas bills. There's a similar story for my electricity consumption, where switching off the DVD players, the stereos, the computer peripherals that were on all the time, and just switching them on when I needed them, knocked another third off my electricity bills too.
So we need a plan that adds up, and I've described for you six big levers, and we need big action because we get 90 percent of our energy from fossil fuels, and so you need to push hard on most if not all of these levers. And most of these levers have popularity problems, and if there is a lever you don't like the use of, well please do bear in mind that means you need even stronger effort on the other levers.
So I'm a strong advocate of having grown-up conversations that are based on numbers and facts, and I want to close with this map that just visualizes for you the requirement of land and so forth in order to get just 16 light bulbs per person from four of the big possible sources. So, if you wanted to get 16 light bulbs, remember, today our total energy consumption is 125 light bulbs' worth. If you wanted 16 from wind, this map visualizes a solution for the U.K. It's got 160 wind farms, each 100 square kilometers in size, and that would be a twentyfold increase over today's amount of wind.
Nuclear power, to get 16 light bulbs per person, you'd need two gigawatts at each of the purple dots on the map. That's a fourfold increase over today's levels of nuclear power.
Biomass, to get 16 light bulbs per person, you'd need a land area something like three and a half Wales' worth, either in our country, or in someone else's country, possibly Ireland, possibly somewhere else. (Laughter)
And a fourth supply side option, concentrating solar power in other people's deserts, if you wanted to get 16 light bulbs' worth, then we're talking about these eight hexagons down at the bottom right. The total area of those hexagons is two Greater London's worth of someone else's Sahara, and you'll need power lines all the way across Spain and France to bring the power from the Sahara to Surrey.
We need a plan that adds up. We need to stop shouting and start talking, and if we can have a grown-up conversation, make a plan that adds up and get building, maybe this low-carbon revolution will actually be fun. Thank you very much for listening. (Applause)
産業革命が始まったとき 石炭として埋蔵されていた イギリスの炭素量は 石油として埋蔵されている サウジアラビアの炭素量に 匹敵していました この炭素が産業革命を後押しして イギリスに繁栄と 他の国々に対する優位性をもたらしました イギリスの石炭生産量は 1918年にピークを迎え それ以降 低下の一途をたどっています この間イギリスは 北海の石油と天然ガスの 使用を開始し 2000年に 北海の石油と天然ガスの生産量も ピークを迎え その後 生産量は減少しています
このように容易に入手できる 自国の化石燃料に 限りがあることを考えると 「次はなに?」と聞きたくなるのは 理解できることです 化石燃料以降の 生活はどのようになるのか 化石燃料からの脱却を真剣に 考えなければならないと思います もう1つの要因はもちろん地球温暖化です
そして人々が化石燃料の 次のエネルギーの話や 地球温暖化防止に 関する話をするとき いろいろな勘違い 間違った情報 誤った宣伝があるように思います そして私には科学者として人々を 誤った情報に惑わされないように 本当に変化を起こすための行動が取れるように 効果のあるアイディアに集中できるように 導く役割があると感じています
これを科学者が「封筒の裏の計算」と呼ぶものを 使って説明します 我々は「封筒の裏の計算」が大好きです 疑問を持ち いくつかの数字を書き出して 答えを出します 正確ではないかも知れませんが 「ふむ」と言うには十分です ここで質問です バイオ燃料を使うことで 化石燃料は不要になる と言ったとします もう輸送手段には石油は不要だと バイオ燃料のための作物を 道路の脇で作るとします 必要なバイオ燃料を得るために どのくらいの幅の作付け面積が必要でしょうか
では数字を入れていきましょう 車の速度を時速60マイルとします 燃費をガロンあたり30マイルとします これは欧州で販売されている新車の平均です バイオ燃料の工場の生産性を 1ヘクタールあたり年間1200リットルとします これは欧州のバイオ燃料の実際の生産性です そして車間が80メートルとします そして車が絶えることなく 走っているとします 道路の長さは問題となりません なぜなら道が延びればバイオ燃料も 多く生産できるからです さてどうするか 最初の数字を残りの3つの数字で 割ると8キロメートルとなります これが答えです これが必要な作付け面積です このような仮定で計算するとです あなたは「ふむ」と言うかも知れません バイオ燃料の利用は 思ったほど簡単ではないかも知れない
そして面積が 問題になるかも知れない と思うかも知れません この講演では 必要な土地の面積に問題があるかどうか お話ししたいと思います 答えはイエスですが あなたがどの国に いるかによって状況は異なります
まずはイギリスから始めましょう 我々が住んでいるところなので イギリスのエネルギー消費を 輸送のためのエネルギー消費だけでなく すべてのエネルギー消費を 電球によって数値化してみたいと思います それはちょうど125個の電球を 常につけているようなものです 一人あたり1日125キロワット時 これがイギリスのエネルギー消費量です 輸送のために40個の電球が必要です 暖房のために40個の電球が必要です 発電のために40個の電球が必要です それ以外のエネルギー消費は 以上の3つの大きなエネルギー消費に比べると 少なくなります このエネルギー消費量は我々が輸入する 品々のためのエネルギーを考慮すると さらに増加します 今日これらのエネルギーの90%は 化石燃料で賄われており 残りの10%だけが 他の環境に優しいエネルギー源から 得られていると推定されます 例えば原子力や再生可能なエネルギーのような
以上が イギリスの状況です イギリスの人口密度は 1平方キロメートル当たり250人です いま他の国々の状況も2つの同じ指標で示します 縦軸には 一人当たりのエネルギー消費量 つまり電球の数を 我々は電球125個のところにいます そして青い点はイギリスの 面積を示しています 横軸は人口密度を示します 我々は1平方キロメートル当たり250人です 欧州の国々を青色で追加しましょう 非常に多様性があることがわかります 両方の軸が対数軸であることを 指摘しておきます 1つのグレーの線から 次のグレーの線までは10倍です 次にアジアの国々を赤で追加しましょう 中東と北アフリカの国々を緑で サハラ以南のアフリカを青で 南アメリカを黒で 中央アメリカを紫で 北アメリカと オーストラリアとニュージーランドを黄色で示します 人口密度と一人当たりのエネルギー消費量に 大きな幅があるのが分かると思います 国によって状況は違います
左上にはカナダ、オーストラリアといった 広大な国土と 200から300個の電球分の高いエネルギー消費と 非常に低い人口密度をもった国々があります 右上には カナダとほぼ同等のエネルギー消費をもつ バーレーンがあります 電球300個分以上です しかし人口密度は約300倍で 1平方キロメートル当たり1000人です 右下には バーレーンと同じ人口密度を持ちながら 100分の一のエネルギー消費量のバングラデシュ
左下には該当する国が今はありませんが 昔はたくさんの国がここにありました この図から読み取れることが他にあります スーダン、リビア、中国、インド バングラデシュに小さな青色のしっぽを付けました これは15年間の変化を示します 15年前にはどこにいて いまはどこにいるでしょうか ここでのメッセージは 多くの国が右上に向かって 移動しているのです 右上 つまり人口密度が高く 一人当たりのエネルギー消費量が多い領域に このちょっと変わった右上のコーナーには イギリスに加えて ドイツ、日本、韓国、オランダ そしていくつかのちょっと変わった国々があります 他の多くの国がこの右上の領域に 我々と合流しようと向かっています 我々は他の国々の未来のエネルギー消費が どのようになるかを示す見本です
私は右下に向かってのびるピンクの線を さらに図に加えました これは単位面積あたりのエネルギー消費量が 等しい線です 平方メートル当たりのワット数で測定しています 例えばこの真ん中の線は 平方メートル当たり0.1ワットの エネルギー消費を示しています 紫色で示したサウジアラビア、ノルウェー、メキシコ そして15年前のバングラデシュが該当します そして世界の人口の半分は すでにこの線より上の国々に住んでいます イギリスは平方メートルあたり1.25ワットを 消費しています ドイツと日本はこれより少し多くの エネルギーを消費しています
さて この線にどのような意味があるのか考えてみましょう 再生可能エネルギーを同じ単位で測定できます そしてその他のエネルギーも同じ単位で測定できます 再生可能エネルギーは我々が化石燃料への90%の 依存をやめるためのアイディアの1つです 再生可能エネルギーはこんな感じです 欧州の気候ではエネルギーに転換できる作物は 平方メートルあたり0.5ワットのエネルギー源です これはどいうことでしょうか もしかすると先ほどお話したバイオ燃料の話から 予想されていたかも知れません 我々は平方メートルあたり1.25ワットの エネルギーを消費します これがどういうことかと言うと イギリス全土をエネルギーに転換できる作物の栽培に 利用したとしても今日のエネルギー消費量を 賄うことができないことを意味します 風力発電はもう少し多くのエネルギーを生産します 平方メートルあたり2.5ワットです 消費するエネルギーは 平方メートルあたり1.25ワットなので 全てのエネルギー消費を風力発電で賄うためには 文字通りイギリス全土の半分を 風力発電設備のために使う 必要があるということになります ちなみにいままでの試算に関しては 裏付けとなるデータがあります
次は太陽光発電です ソーラーパネルを屋根に取り付けた場合 イギリスでは平方メートルあたり20ワットの エネルギーになります 大量のソーラーパネルをもつ施設の場合 伝統的なババリア農法を適用する必要があります つまり建物の屋根だけではなく田園地方も ソーラーパネルで埋めることが必要です ソーラーパークはパネル同士が離れているので エネルギー効率は平方メートルあたり 約5ワットに落ちます バーモント州にあるソーラーパークの実際の値では 平方メートルあたり4.2ワットです 我々は平方メートルあたり1.25ワットを消費します 風力発電は2.5、ソーラーパークは5 従ってどのような再生可能エネルギーを選んだとしても どのような組み合わせにするかに関わらず イギリス全土のエネルギーを賄うためには 国土の20%から25%を 再生可能エネルギーのために 使う必要が出てきます 悪いアイディアだとは言いませんが 数字も理解する必要があります 私は再生可能エネルギーに反対者ではなく 大好きです しかし私は数字信奉者でもあります (笑)
砂漠での太陽光発電は 単位面積あたりより多くのエネルギーを 提供可能です なぜなら雲の問題がないからです 平方メートルあたり14ワットです これは平方メートルあたり10ワット こちらのスペインの施設では平方メートルあたり5ワット 太陽光発電は平均としては 平方メートルあたり20ワットのエネルギーを 提供可能だと思います すばらしいことです もちろんイギリスに砂漠はありません まだ (笑)
ここまでの結論を整理します すべての再生可能エネルギーは分散型です 単位面積あたりのエネルギー量が小さいものばかりです この制約はしかたありません 再生可能エネルギーを使って 現在のエネルギー消費量を維持しながら イギリスのような国で 現実的な効果を上げるためには 再生可能エネルギーのための施設が 国家規模でなければなりません 国全部ではないにしても かなりの割合の面積が施設のために必要となります
化石燃料を使わない 他のエネルギーもあります 例えば原子力発電 この陸地測量図で サイズウェルBが青い線で囲まれた1平方kmの なかにあることが確認できると思います これは平方キロメートルあたり1ギガワット つまり平方メートルあたり1000ワットです 従ってこの指標に従う限り原子力発電は 再生可能エネルギーほど 場所はとりません
明らかに他の指標も問題となります 原子力発電は いろいろな問題が指摘されています ただこれは再生可能エネルギーでも 同じことです これは抗議行動の写真です エジンバラ郊外の ペニキュイックという小さな町です ペニキュイックの子供達がハリボテの 風車を燃しています 人々はいろいろなことに反対するので 選択可能な候補は 全て残しておかなければなりません
エネルギー供給の観点からイギリスのような国に できることは何でしょうか 3つの選択肢があると思います 再生可能エネルギーを選び そのために国土と同じくらいの面積を用意する選択 左上の国々に対して 礼儀正しく 我々は裏庭に再生可能エネルギーの 施設を置きたくないので あなたの国に置かせてもらえないかと お願いする選択 これは真面目な選択です 世界規模でこの問題に取り組むための方法で オーストラリア、ロシア、リビア、カザフスタン といった国々が 再生可能エネルギーの生産において我々の 大事な友達となります 3つ目の選択は原子力発電です 以上が供給の観点から見た選択肢です
我々が設定することのできる供給のつまみに加えて 我々には大量のエネルギーが必要なことを お忘れなく なぜなら今 我々は90%のエネルギーを化石燃料から得ています このつまみに加えて 問題を解決する ほかの方法もあります つまりエネルギーの消費量を減らすことです これは人口を減らすことを意味します これを実現する方法を私は知りません あるいは一人当たりの エネルギー消費量を減らすことです
ここで3つの大きなつまみの話をしましょう 消費の観点から有効なつまみです 最初は交通関連です 物理法則から以下のこのとがわかります 交通関連のエネルギー消費量を減らすために どうすればいいか 技術がすべてのことを解決できると 言いますが 我々が100倍エネルギー効率のいい乗り物を 作ることができるとすれば 大枠としてこれは正しい意見です
この大型自動車のエネルギー消費量は 一人が1時間あたり100Km移動するとして 80キロワットです これはヨーロッパ車の平均的な値です 時間あたり80キロワット これと比べて100倍効率のいい 乗り物を作ることは可能でしょうか 可能です 自転車が答えで80倍に効率が向上します バイオ燃料の一種の 朝食シリアルで動きます (笑) そして自動車と自転車の中間も選べます 大型車の利用者は そんなふうにライフスタイルを変えられない と言うでしょうから 電車を使うように 説得できるかも知れません これは自動車よりは効率がいい乗り物です ライフスタイルは変わるでしょうが 左上にはエコカーもあります 10代の若者が一人乗れるサイズで 道路工事用円錐標識より低く 自転車とほぼ同じ効率ですが 時速15マイルで移動することが前提です この間にもっと現実的な選択肢があります このつまみ ― 交通手段のつまみは 電動の乗り物です 電気バイクと電気自動車が真ん中にあります おそらくガソリンを燃料とする 普通の自動車と比べて4倍効率的です
次は暖房に関するつまみです 暖房はイギリスで3番目に エネルギーを消費する項目です 大部分は家庭や ビルの暖房と給湯で消費されます これはよくあるイギリスの住宅です これは私の家で 前にフェラーリを停めています 何ができるでしょう 物理法則はご覧の通りです 暖房に関するエネルギー消費に 何がどのように影響するかがわかります 我々が制御できるのは室内と外の温度差で サーモスタットという驚くべき技術を 利用することができます つまみをつかんで左にまわすことで 家庭のエネルギー消費量を減らすことができます 試してみましたが効果的でした 人によってはこれをライフスタイルの変更と呼びます 業者を呼んで建物の放熱を低下させることも可能です 断熱材を壁や屋根に入れて 新しい玄関の扉をつけるといったことです 悲しい事実はこれが節約につながるということです これはいいことではありますが 放熱の25%程度しか押さえられないという 現実です このようなことを実行することで スウェーデンの標準的な建物に近づきたいと 真剣に考えるのならば 追加の断熱材を建物の外部に入れる必要があります このロンドンにあるアパートのように さらにヒートポンプを使うことで 熱を効率的に使うこともできます 電気のような高いグレードのエネルギーを 少々使用することで 庭の熱を家の中に引き込むことが可能です
消費側の3つ目の エネルギーを削減する選択肢は 電力メーターを読むということです スマートメーターが話題ですが 自分でも読めます 自分の目を使ってスマートにメーターを読む あなたが私と似たタイプなら 人生が変わります これは私が作ったグラフです 私は持続可能エネルギーに関して本を書いていました 友人に「家ではエネルギーをどのくらい 使っている?」と聞かれて わからなかったので恥ずかしい思いをしました そこで毎週電力メーターを読むことにしました これがその結果です 上が古いもの 下の緑が2007年です 毎週電力メーターを読むことで 生活が変わりました 私は何がエネルギー消費に影響するか 実験を始めました サーモスタットをいじったり 暖房システムのタイミングを変えることで ガスの消費量が激減しました この結果ガス料金は約半分になりました 電気に関しても同じような結果になりました 常に電源がオンになっていた DVDプレーヤーやステレオ コンピュータの周辺装置類の 電源をオフにすることで そして必要な時だけ オンにすることで 更に3分の1の電気料金を 削減することができました
お話ししたように 計算の合う計画が必要です 6個のつまみがあり 90%のエネルギーを化石燃料から得ているので 大胆な行動が必要です 全てと言わないまでも 多くのつまみで削減の努力が必要です そして多くのつまみは 「好み」に関連しています もし使いたくないつまみが あるとすれば それは他のつまみで より多くの努力をする必要がある ということを忘れないでください
私は数字や事実に基づいた 大人の会話をすることが 大切だと考えています 最後に この地図の話をしたい思います これは一人あたり 電球16個分のエネルギーを 用意するために必要な 土地の面積等々です 4つエネルギー供給源候補に関して 記載しています これは電球16個分のエネルギーが 必要な場合です 我々のエネルギー消費量の合計は 電球125個分だということを覚えておいてください 16個分を風力エネルギーから得る場合 イギリスの場合 100平方キロあたり風力発電施設が 160カ所必要となります これは現在の風力発電設備の規模の 20倍になります
原子力を利用する場合には 2ギガワットの発電設備が 地図上の紫の点ごとに 必要となります これは現状の原子力発電設備の4倍です
バイオマス発電では一人あたり電球16個分の エネルギーを用意するために ウェールズ地方の 3.5倍の土地が必要となります 国内のどこかか国外のどこかにに アイルランドかどこかほかのところでしょうか (笑)
4つ目の候補の太陽光発電の場合 だれか他人の砂漠が必要となります 電球16個分のエネルギーが必要な場合です そして右下にある8個の六角形の 話をしました これら六角形の合計面積は 大ロンドン2つ分の だれか他人のサハラ砂漠です そしてサハラ砂漠からイギリスのサリーまで 電力を送るためにスペインと フランスに高圧線が必要となります
計算の合う計画が必要です 怒鳴り合うのをやめて 話し合いを始めることが必要です そして大人の会話ができるのならば 計画を決めて実行しなければなりません この低炭素革命は 面白いことになるかも知れません ご清聴ありがとうございました (拍手)
品詞分類
- 主語
- 動詞
- 助動詞
- 準動詞
- 関係詞等
TED 日本語
TED Talks
関連動画

印刷できる柔軟な有機太陽電池ハナ・ブルクシュトゥマ
2018.05.08気候変動の解消に向けた原子力発電の必要性ジョー・ラシター
2016.12.19同期したハンマーの一撃が核融合を成功に導くマイケル・ラバーグ
2014.04.22行動科学で電気代が安くなるわけアレックス・ラスキー
2013.06.04僕のラジカルな計画―小型核分裂炉で世界を変えるテイラー・ウィルソン
2013.04.30次世代バイオ燃料生産、海に浮かべる藻のゆりかごジョナサン・トレント
2012.09.08エネルギーの40ヶ年計画エイモリー・ロビンス
2012.05.01再生可能エネルギーを本当に使えるようにするにはドナルド・サドウェイ
2012.03.26うん、核融合炉を作ったよテイラー・ウィルソン
2012.03.22天然ガスでエネルギーを変革しようT.ブーン・ピケンズ
2012.03.19送電網を必要としないエネルギーをジャスティン・ホール・ティピング
2011.10.18「脱石油」について語るリチャード・シアーズ
2010.05.20未来エネルギーの核融合スティーヴン・カウリー
2009.12.22未来の再生可能エネルギーとしての凧ソール・グリフィス
2009.03.22

洋楽 おすすめ
RECOMMENDS
洋楽歌詞
ダイナマイトビーティーエス
洋楽最新ヒット2020.08.20ディス・イズ・ミーグレイテスト・ショーマン・キャスト
洋楽人気動画2018.01.11グッド・ライフGイージー、ケラーニ
洋楽人気動画2017.01.27ホワット・ドゥ・ユー・ミーン?ジャスティン・ビーバー
洋楽人気動画2015.08.28ファイト・ソングレイチェル・プラッテン
洋楽人気動画2015.05.19ラヴ・ミー・ライク・ユー・ドゥエリー・ゴールディング
洋楽人気動画2015.01.22アップタウン・ファンクブルーノ・マーズ、マーク・ロンソン
洋楽人気動画2014.11.20ブレイク・フリーアリアナ・グランデ
洋楽人気動画2014.08.12ハッピーファレル・ウィリアムス
ポップス2014.01.08カウンティング・スターズワンリパブリック
ロック2013.05.31ア・サウザンド・イヤーズクリスティーナ・ペリー
洋楽人気動画2011.10.26ユー・レイズ・ミー・アップケルティック・ウーマン
洋楽人気動画2008.05.30ルーズ・ユアセルフエミネム
洋楽人気動画2008.02.21ドント・ノー・ホワイノラ・ジョーンズ
洋楽人気動画2008.02.15オンリー・タイムエンヤ
洋楽人気動画2007.10.03ミス・ア・シングエアロスミス
ロック2007.08.18タイム・トゥ・セイ・グッバイサラ・ブライトマン
洋楽人気動画2007.06.08シェイプ・オブ・マイ・ハートスティング
洋楽人気動画2007.03.18ウィ・アー・ザ・ワールド(U.S.A. フォー・アフリカ)マイケル・ジャクソン
洋楽人気動画2006.05.14ホテル・カリフォルニアイーグルス
ロック2005.07.06